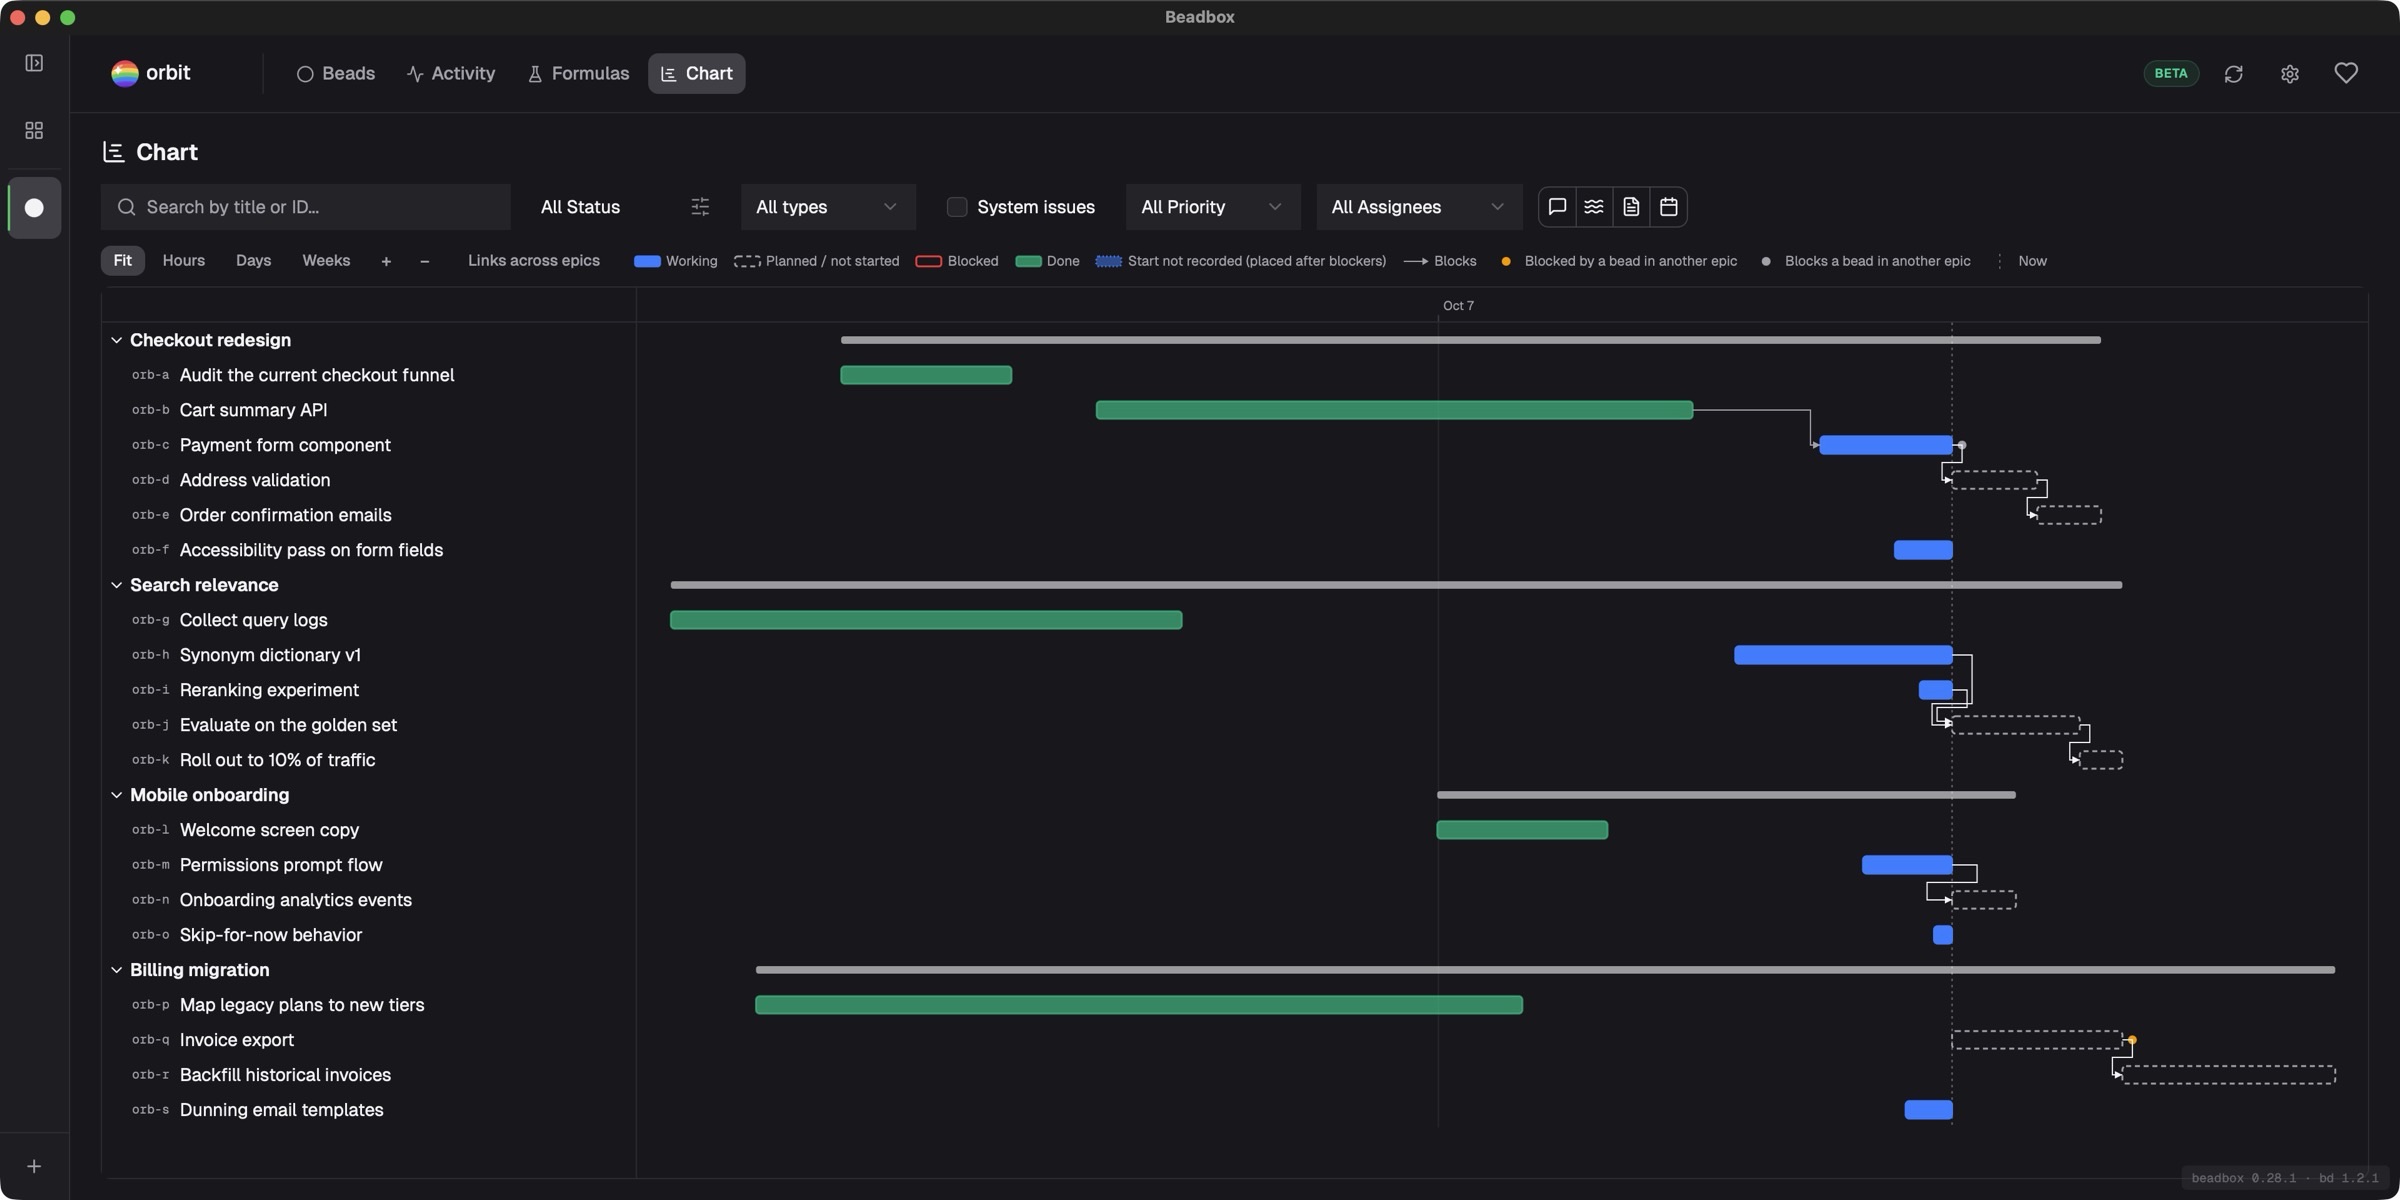
The epic tree shows you structure. Which beads belong to which epic, what's done, what's left. What it never showed you is time.
Run a few coding agents on one bd project and time is the question you keep answering by hand. What's running right now? Since when? What's waiting on what? In what order can the rest of the work actually happen?
Beadbox 0.28 answers it with a new view. The Chart tab shows each epic as a timeline.
What happened, and what's planned
The chart has a dashed now line. Everything left of it is the record. Everything right of it is the plan.
On the left, each bead runs from when work on it started to when it closed. A bead that's still running stretches to now. You can see at a glance which agent's task has been open for twenty minutes and which has been open since yesterday.
On the right, beads that haven't started are placed after everything that blocks them, for their estimated time. A bead with no estimate gets an hour. So a dependency chain reads left to right in the order it has to happen, and independent work sits side by side. The plan is worked out fresh every time the chart draws. Nothing about it is stored.
It reads bd's own start times
When a bead first goes to in progress, or someone claims it, bd records a start time. The Chart view reads that field. It doesn't keep a second clock of its own, and opening the chart never writes anything to your workspace.
Some beads have no start time: one moved straight to a custom status, say, or closed without ever being started. Those are placed after their blockers and drawn dotted and faded. The legend labels them Start not recorded, so a guess never passes for a fact.
Dependencies you can follow
Inside an epic, arrows run from the end of a bead to the start of the bead it blocks. They route through the gaps between bars, so they never cut across one.
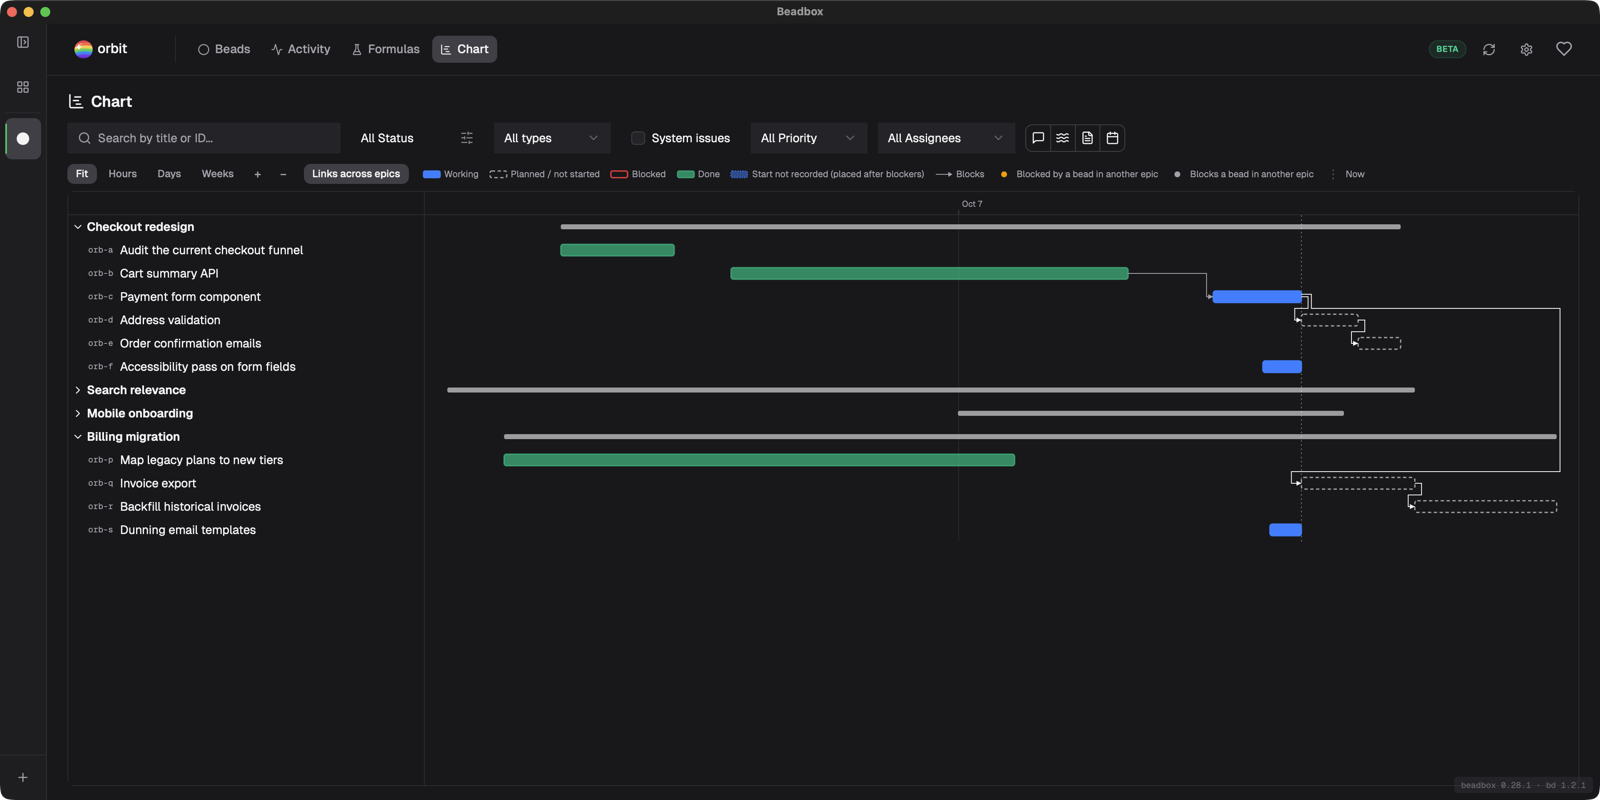
A dependency on a bead in another epic shows as a dot on the bar. Hover over it, or tab to it, to see which bead it points at. If you'd rather see those as arrows too, turn on Links across epics next to the zoom controls. Cross-epic dependencies then draw as routed arrows like the rest, and a link into a collapsed epic attaches to that epic's header. It's off by default.
Zoom from weeks down to minutes
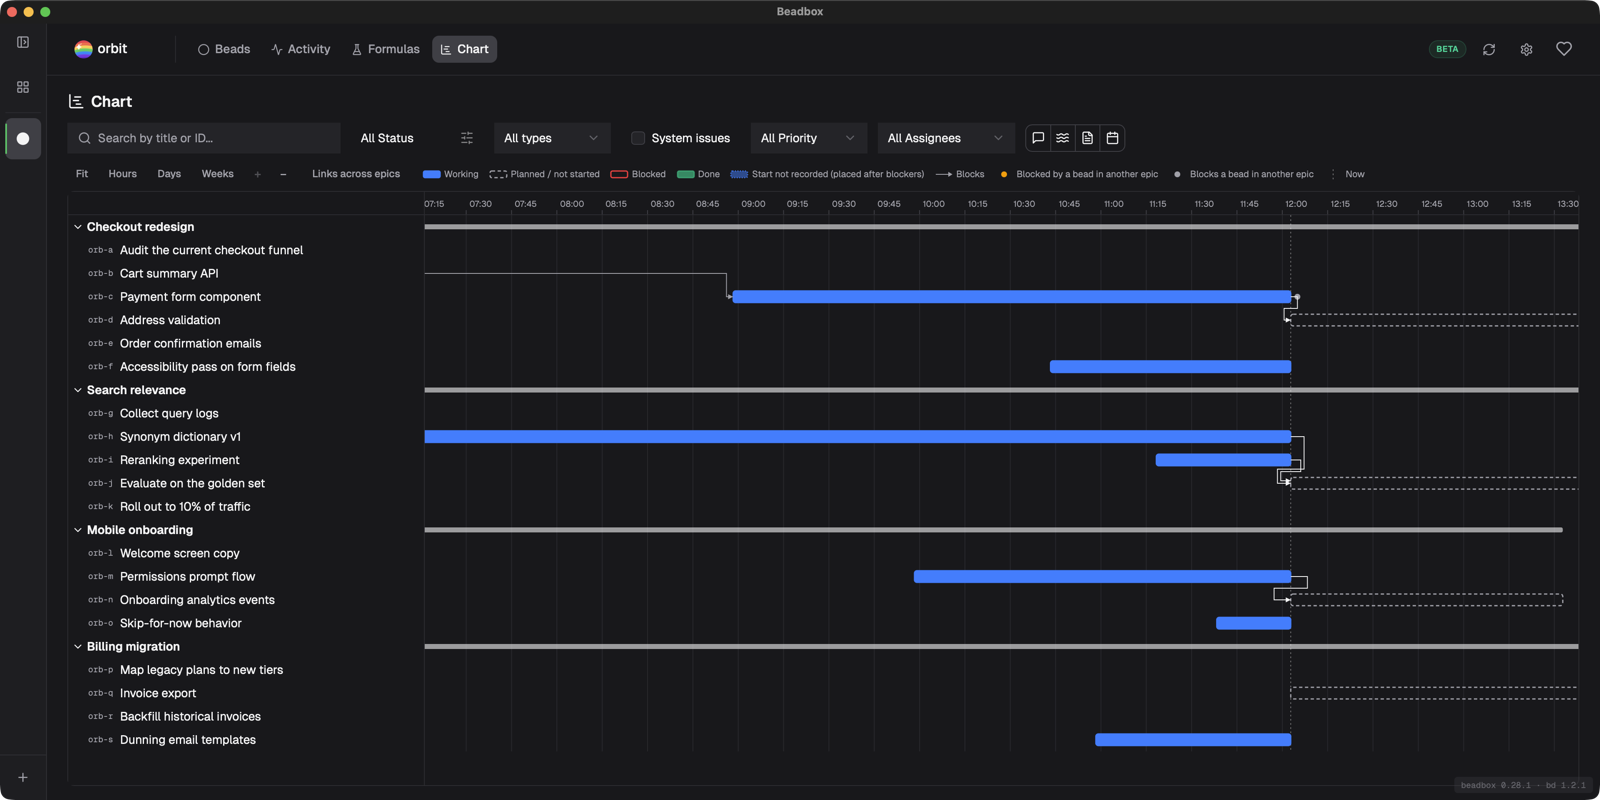
Zoom between hours, days and weeks, fit everything on screen, or step in between with + and −. Agents often finish a bead in minutes, so past the hours zoom the axis labels every 30 minutes, then every 15.
Zooming keeps now in view. After every zoom step except Fit, the chart scrolls so the current time sits about three-quarters of the way across: recent work on the left, the near plan on the right.
Built for long lists
Titles stay put while the timeline scrolls. Drag the edge of the title column to widen it, up to 600 px, so long bead titles stop getting cut off. Click a title or a bar to open the bead.
The chart uses the same filters as the Beads view, leaves archived items out, puts loose beads under Ungrouped, and updates live as your agents work.
We tested it on a synthetic project with 5,000 beads. It takes a few seconds to open at that size, and it stays usable after that.
Built by the community
The Chart view was designed and built by Stephan Michard (@smichard). He opened #51 with the whole view: the timeline, the dependency routing and the plan that follows it. Then, after living with it, he sent #53 with five fixes that came from using it: clickable bars, the resizable title column, links across epics, minute labels and zoom that keeps now in view.
We changed two things on the way in. #51 recorded its own start time for each bead; bd already keeps one, so we read that instead, which is why opening the chart leaves your workspace untouched. And beads with no recorded start now get their own dotted style, so a guess never looks like a record. The rest landed as Stephan wrote it.
Beadbox is open source under the MIT license. If something in your workflow is missing, a pull request is the fastest way to get it in. This one shipped in two releases.
Try it
The Chart view is in Beadbox 0.28.1. Open the Chart tab (⌘5 on a Mac).
brew install --cask beadbox/cask/beadbox
Or download it from beadbox.app. It needs the beads CLI, version 1.1.0 or newer.