You can run 10 AI coding agents in parallel now. Give each one an issue, point them at a shared beads database, and let them work. Agents create subtasks, file bugs they discover, update statuses, and close issues when they're done. It's genuinely productive.
Until something blocks.
When a human gets blocked, they say something. They post in Slack, they flag it in standup, they walk over to someone's desk. Agents don't do any of that. An agent hits a dependency it can't resolve, and it either silently stalls or starts working around the problem in ways that create more problems. Three agents can be stuck on the same unresolved upstream task and you won't know until you wonder why nothing has shipped in four hours.
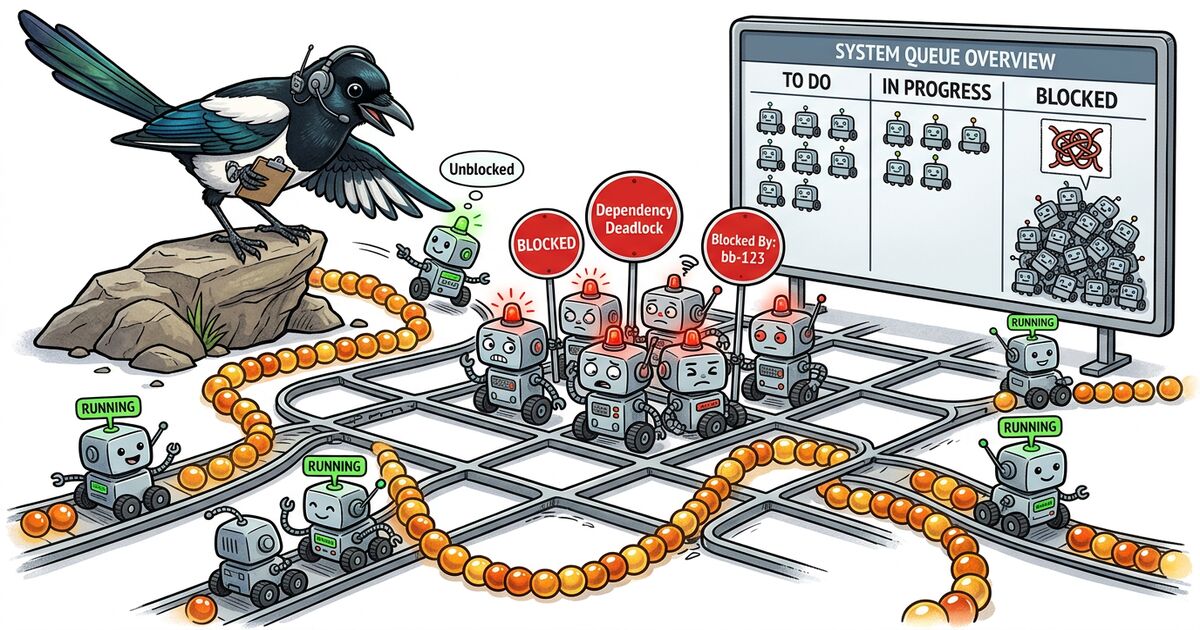
This is the triage problem for agentic development. Not "how do we run better standups" but "how do we see what's stuck across a fleet of autonomous workers that don't complain." Here's what we've learned building Beadbox, a real-time dashboard for beads that shows you exactly what your agents are doing, what they're blocked on, and what just became available.
Jump to what matters to you:
How agents create blocking chains
Agents generate dependency problems differently than human teams. Understanding the failure modes matters because the triage responses are different.
Agents don't model dependencies upfront. A human architect decomposes a feature into tasks and thinks about ordering. A coding agent receives a task, starts working, and discovers mid-implementation that it needs something that doesn't exist yet. It might file a new issue for that dependency. It might try to build it inline and create a mess. It might just stop. None of these outcomes are visible unless you're watching the issue database.
Agents work faster than dependency graphs update. Agent-3 closes a task that Agent-7 was waiting on, but Agent-7 doesn't know because it checked for blockers 10 minutes ago. Meanwhile Agent-7 is still idle or working on something lower priority. The unblock happened, but the information didn't propagate.
Circular dependencies emerge from parallel decomposition. When multiple agents decompose work simultaneously, they can create cycles that no single agent sees. Agent-1 creates Task A that depends on Task B. Agent-2 creates Task B that depends on Task C. Agent-3 creates Task C that depends on Task A. Each dependency made sense locally. The cycle is only visible from above.
Resource contention is invisible. Two agents both need to modify the same file, or both need the staging environment, or both need the same shared library to be in a stable state. There's no dependency filed because neither agent knows the other exists. They just both slow down and neither one reports why.
The common thread: agents produce blocking situations faster than they report them. The supervisor (you) needs tooling that surfaces blocks automatically, not tooling that waits for someone to raise a flag.
Automated dependency detection
The fix is explicit, queryable dependency data created at task time and checked continuously. Here's what that looks like with beads, the Git-native issue tracker we run our agent fleet on.
Agents record dependencies when they create tasks:
# Agent creates a task and discovers it needs an API that doesn't exist
API_TASK=$(bd create \
  --title "Implement /api/v2/orders endpoint" \
  --type task --priority 2 --json | jq -r '.id')

# Agent creates its own task and declares the dependency
UI_TASK=$(bd create \
  --title "Build order history page" \
  --type task --priority 2 --json | jq -r '.id')

bd dep add "$UI_TASK" "$API_TASK"
That bd dep add is a single CLI call. Any AI coding agent (Claude Code, Cursor, Copilot Workspace) can run it. No API client library, no authentication dance. The dependency is now structured data, queryable by any other agent or script.
Cycle detection runs automatically:
# beads checks the full dependency graph for cycles
bd dep cycles

# Output when cycles exist:
# CYCLE DETECTED: beads-a1b -> beads-c3d -> beads-e5f -> beads-a1b
On a 5,000-dependency graph, this takes ~70ms. Run it as a post-commit hook or on a 5-minute cron. When three agents independently create a dependency cycle, you catch it in minutes instead of discovering it hours later when all three are stalled.
Surface every blocked task in one command:
bd blocked --json | jq -r '.[] |
  "BLOCKED: \(.id) \(.title)\n  waiting on: \(.blocked_by | join(", "))\n  assignee: \(.owner // "unassigned")\n"'
Output:
BLOCKED: beads-x7q Build order history page
  waiting on: beads-m2k Implement /api/v2/orders endpoint
  assignee: agent-3

BLOCKED: beads-r4p Deploy staging environment
  waiting on: beads-j9w Fix Docker build, beads-n1c Update TLS certificates
  assignee: agent-7
Now you know Agent-3 and Agent-7 are stuck, what they're stuck on, and what needs to happen to unblock them. That entire query took 30ms on a 10K-issue database.
Detect blocked PRs from branch naming conventions:
#!/bin/bash
# blocked-prs.sh: find PRs whose dependencies haven't merged

for pr in $(gh pr list --json number,headRefName --jq '.[].headRefName'); do
  ISSUE_ID=$(echo "$pr" | grep -oE 'beads-[a-z0-9]+')
  [ -z "$ISSUE_ID" ] && continue

  BLOCKERS=$(bd show "$ISSUE_ID" --json | jq -r '.blocked_by[]' 2>/dev/null)
  for blocker in $BLOCKERS; do
    BLOCKER_STATUS=$(bd show "$blocker" --json | jq -r '.status')
    if [ "$BLOCKER_STATUS" != "closed" ]; then
      echo "PR ($pr) blocked: $ISSUE_ID waiting on $blocker ($BLOCKER_STATUS)"
    fi
  done
done
Twenty lines of shell. Runs locally, reads local data, tells you which PRs from your agents can't merge yet and why.
A CLI-first triage workflow
Triage in an agentic workflow isn't a meeting. It's a script that runs on a loop. The supervisor (human or agent) looks at what's stuck and makes a decision for each item.
Here's the triage script we actually run:
#!/bin/bash
# triage.sh: agentic fleet blocker triage

echo "========================================="
echo "TRIAGE REPORT: $(date +%Y-%m-%d %H:%M)"
echo "========================================="

# 1. What's blocked?
echo -e "\n--- BLOCKED TASKS ---"
bd blocked --json | jq -r '.[] |
  "[\(.priority)] \(.id) \(.title)
    blocked by: \(.blocked_by | join(", "))
    assignee: \(.owner // "unassigned")\n"'

# 2. What's available for agents to pick up?
echo -e "\n--- READY (unblocked, open) ---"
bd ready --json | jq -r '.[] |
  "[\(.priority)] \(.id) \(.title) (\(.owner // "unassigned"))"'

# 3. Which agents have gone quiet?
echo -e "\n--- STALE IN-PROGRESS (no update in 2h) ---"
CUTOFF=$(date -v-2H +%Y-%m-%dT%H:%M:%S 2>/dev/null || date -d '2 hours ago' --iso-8601=seconds)
bd list --status=in_progress --json | jq -r --arg cutoff "$CUTOFF" '.[] |
  select(.updated_at < $cutoff) |
  "STALE: \(.id) \(.title) (last update: \(.updated_at), assignee: \(.owner // "unknown"))"'

# 4. Dependency health
echo -e "\n--- DEPENDENCY CYCLES ---"
bd dep cycles 2>&1 || echo "No cycles detected."

echo -e "\n--- FLEET STATS ---"
bd stats
For human teams, "stale" means 48 hours with no update. For agents, 2 hours of silence on an in-progress task is a red flag. Either the agent is stuck and not reporting it, or it crashed. Either way, you need to look.
The decision tree for each blocked item:
- Can another agent unblock it? Reprioritize the blocking task, assign an available agent.
- Is the dependency false? Agents sometimes file overly conservative dependencies during planning. If the block isn't real, remove it:
bd dep remove beads-x7q beads-m2k (removes the dependency of x7q on m2k, instantly unblocking x7q).
- Can the work be split? Have the blocked agent do the parts that don't need the dependency. Create a follow-up task for the rest.
- Is it an external block? Something only a human can resolve (API key, design decision, access grant). Tag it, note the expected resolution, and reassign the agent to other ready work.
Option 2 happens constantly with agents. They model dependencies based on their understanding of the codebase at planning time. Once implementation starts, the real shape of the work reveals that half those dependencies were unnecessary.
Real-time visibility into agent work
Running a triage script every 30 minutes leaves gaps. When agents work fast, a lot happens between checks. The question becomes: can you see blocks form in real time?
How Beadbox does it:
The beads database lives in a .beads/ directory on your filesystem. Every bd update, bd create, or bd close an agent runs writes to that directory. Beadbox watches it with fs.watch() and pushes changes to the UI over WebSocket within milliseconds.
The practical effect: Agent-5 runs bd update beads-x7q --status=closed in a terminal. The Beadbox dashboard immediately shows that task as closed, and any task that was blocked on it lights up as newly available. You see the cascade without running any command.
This matters because agentic work creates bursts. An agent might close three tasks in 90 seconds, each unblocking different downstream work. A polling-based dashboard with a 30-second refresh interval would show you a confusing intermediate state. Sub-second propagation shows you the full picture as it happens.
If you don't use Beadbox, filesystem watches still work:
# Watch the beads database for changes, alert on new blocks
# Note: fswatch fires on every write. In production you'd debounce this
# (e.g., sleep 2 after each trigger) to avoid noise during burst writes.
fswatch -o .beads/ | while read; do
  BLOCKED_COUNT=$(bd blocked --json | jq length)
  if [ "$BLOCKED_COUNT" -gt 0 ]; then
    echo "$(date): $BLOCKED_COUNT tasks currently blocked"
    # Pipe to ntfy, Slack webhook, or any notification system
  fi
done
Close the loop with CI:
# In your CI post-build step: auto-close the issue when the build passes
if [ "$BUILD_STATUS" = "success" ]; then
  ISSUE_ID=$(echo "$BRANCH_NAME" | grep -oE 'beads-[a-z0-9]+')
  if [ -n "$ISSUE_ID" ]; then
    bd update "$ISSUE_ID" --status=closed
    bd comments add "$ISSUE_ID" --author ci \
      "Build passed. Commit: $COMMIT_SHA. Closing automatically."
  fi
fi
When CI closes that issue, everything it was blocking becomes unblocked. If an agent is watching bd ready for new work, it picks up the unblocked task automatically. No human in the loop for routine unblocks.
This is the difference between tools that track status and tools that propagate it. Most project management software does the former: you update a card, the card changes color. Propagation means downstream effects (unblocking dependents, surfacing available work, updating progress rolls) happen without anyone clicking anything.
If you're shopping for tooling to manage an agent fleet, the requirements are different from what a human team needs.
Must-have: CLI that agents can call. If your issue tracker only has a web UI, agents can't use it. They need to run shell commands. bd create, bd update, bd blocked are all one-liners that any coding agent already knows how to execute. REST APIs work too, but they require auth tokens, HTTP clients, and error handling. Unix pipes are simpler.
Must-have: queryable dependency graph. "Blocked" as a status label is useless for automation. You need A depends on B as structured data so scripts can traverse the graph, detect cycles, and compute what's ready.
Must-have: sub-second local reads. When agents query for available work, the response time matters. A 2-second API round-trip per query, multiplied by 10 agents polling every minute, creates measurable overhead. beads returns bd ready results in 30ms on a 10K-issue database because everything is local.
Nice-to-have: real-time change propagation. If agents file and resolve 50 issues per hour, you need to see the state as it changes, not on a refresh interval.
Red flag: "AI-powered blocker detection." Tools that claim to detect blockers by analyzing issue descriptions produce false positives and miss real blockers that were never written down. Explicit bd dep add declarations beat inference.
Red flag: tools that require a browser to triage. Unblocking one task through a web UI takes 5-15 seconds of clicking. Through the CLI, bd dep remove takes 18ms. Over 50 blocked tasks, that's 1 minute vs 12 minutes. When you're supervising agents that move fast, triage speed is your bottleneck.
| Capability |
Jira |
Linear |
GitHub Issues |
beads + Beadbox |
| Dependency tracking |
Plugin (Advanced Roadmaps) |
Relations (partial) |
Tasklist references |
First-class bd dep add |
| Blocked status auto-set |
Manual |
Manual |
Manual |
Automatic from deps |
| Cycle detection |
No |
No |
No |
Built-in (bd dep cycles) |
| CLI for agents |
Jira CLI (third-party) |
Linear CLI (limited) |
gh (no deps) |
Full (bd blocked, bd ready) |
| Real-time propagation |
Webhook (server-side) |
Webhook (server-side) |
Webhook (server-side) |
fs.watch (sub-second, local) |
| Works offline / local |
No |
No |
No |
Yes (embedded mode) |
| Agent-scriptable |
API + auth tokens |
API + auth tokens |
gh CLI |
bd CLI (Unix pipes) |
The supervisor loop
Here's the workflow we run daily, managing 10+ AI agents on a single project:
-
Agents declare dependencies at task creation time. Every bd create that has a prerequisite gets a bd dep add immediately. This is a single extra CLI call per task.
-
A supervisor agent runs bd blocked every 30 minutes. If something is newly blocked, it either resolves the blocker itself (reprioritize, reassign) or flags it for the human.
-
Beadbox runs on the human's screen. The dashboard shows the full dependency graph with blocked tasks highlighted in real time. Most of the time, the automation handles routine unblocks. When it can't (external dependency, architectural decision, access grant), the human sees the problem immediately and intervenes.
-
Stale tasks get flagged aggressively. An agent that hasn't updated its in-progress task in 2 hours is either stuck or crashed. The supervisor checks and either nudges the agent, reassigns the work, or investigates.
-
False dependencies get pruned continuously. Agents over-declare dependencies during planning. As implementation reveals the real shape of the work, the supervisor (or agents themselves) remove dependencies that turned out to be unnecessary. A clean graph is a useful graph.
The underlying principle: agents are fast but not self-aware. They don't know what other agents are doing, they don't notice when blockers resolve, and they don't complain when they're stuck. The supervisor's job is to be the nervous system that connects all of that. Structured dependency data, queried automatically and rendered visually, is what makes that possible.
Beadbox is free during the beta. It shows you what your agents are doing, what's blocked, and what just became available, in real time.
brew tap beadbox/cask && brew install --cask beadbox
If you already use beads, Beadbox reads your existing .beads/ directory with no import step. Try it.