How to Monitor Multiple Claude Code Agents Working in Parallel
You spun up six Claude Code agents across tmux panes. Each one claimed a task. They're all producing output, scrolling faster than you can read. One just committed something. Another is running tests. A third has been suspiciously quiet for 20 minutes.
You have no idea what's actually happening.
This is the central problem with parallel agent workflows. The agents themselves are productive. Claude Code can claim work, write code, run tests, and report completion through structured commands. But the human supervising six or ten of these agents has no aggregated view. You're left switching between tmux panes, scrolling terminal history, and reconstructing the project state in your head.
That works for two agents. It falls apart at five.
How agents report work through beads
The foundation is beads, an open-source Git-native issue tracker built for exactly this workflow. beads gives agents a structured way to record what they're doing, and gives you a structured way to query it. Every agent action becomes a CLI command that writes to a local database.
Every one of those commands takes milliseconds. Every one writes to the same local database. The agents don't need API tokens, HTTP clients, or authentication flows. They run shell commands, the same way they run git commit or npm test.
After a few hours of parallel work, that database contains the full picture: who's working on what, what's blocked, what just finished, and what's available. The information exists. The problem is seeing it.
What bd list can't show you
You can query the database from the terminal:
bd list --status=in_progress
bd blocked
bd ready
Each of those commands returns useful data. But they return it as flat text, one snapshot at a time. To understand your project's state, you run bd list, then bd show on a few issues, then bd dep list to see what's blocking what, then bd blocked to find stalled agents. You piece together the picture manually.
When agents are moving fast (closing three issues in 90 seconds, each unblocking different downstream work), the CLI can't keep up with the rate of change. By the time you finish reading bd blocked, two of those blockers have already resolved.
This is the problem Beadbox solves.
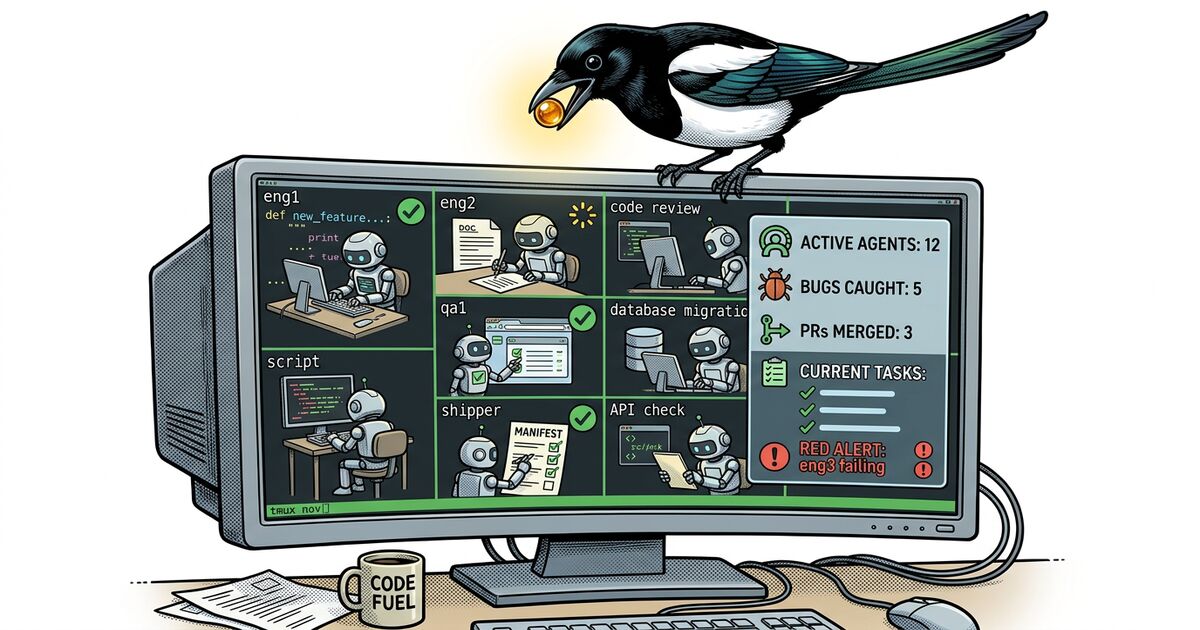
Real-time visibility into what your entire agent fleet is doing.
Beadbox is a native desktop app that watches your .beads/ directory and renders the full project state in real time. When an agent runs bd update in a terminal, Beadbox picks up the filesystem change and pushes it to the UI over WebSocket within milliseconds. No polling. No refresh button. No switching between tmux panes to figure out who did what.
Here's what that gives you concretely:
Epic progress trees. Your top-level feature shows 7 of 12 subtasks complete. Expand it and you see which subtasks are in progress (and which agent owns each one), which are blocked, and which just became available. One glance replaces a dozen bd show commands.
Dependency badges on every issue. You see instantly that bb-q3l is waiting on bb-f8o without running a single command. When bb-f8o closes, bb-q3l lights up as unblocked. The cascade is visible as it happens.
Blocked task highlighting. Every blocked issue surfaces with its blocking dependencies listed inline. You don't hunt for blockers. They're on screen, sorted by priority, the moment they exist.
Multi-workspace switching. If you're running agents across multiple projects, switch between beads databases from a dropdown. Each workspace remembers its own filters and view state.
Real-time sync. The update pipeline is fs.watch on the .beads/ directory, pushed over WebSocket to the React UI. Sub-second propagation means you see agent activity as it happens, not on a 30-second polling interval.
The monitoring workflow
Once Beadbox is open alongside your tmux session, monitoring becomes pattern recognition instead of active investigation. Here's what to watch for:
Stale in-progress tasks. An agent that claimed a task two hours ago and hasn't updated it is either stuck or crashed. In a human workflow, two hours means nothing. For an agent, silence that long is a red flag. Check the tmux pane, nudge the agent, or reassign the work.
Blocked task accumulation. If blocked tasks start piling up and they all point to the same unresolved dependency, that dependency is your critical path. Reprioritize it, assign your fastest agent, or resolve it yourself.
False dependencies. Agents over-declare dependencies during planning. They model what they think they'll need based on their initial read of the codebase. Once work starts, many of those dependencies turn out to be unnecessary. When you spot a blocked task whose dependency looks wrong, remove it:
bd dep remove bb-q3l bb-f8o
That one command instantly unblocks the task. In Beadbox, you see it shift from blocked to available in real time.
Ready work with no assignee. After a cascade of unblocks, you might have five tasks suddenly available with no agent assigned. That's your dispatch moment. Point idle agents at the highest-priority ready work.
The triage loop is simple: scan for blocks, resolve or reassign, scan for ready work, dispatch. Beadbox makes each scan a glance instead of a sequence of CLI commands.
Why this matters at scale
Two agents, you can supervise by watching terminals. Three or four, you start losing track. At six or ten, you need instrumentation.
The agents themselves are not the bottleneck. Claude Code is fast. It writes code, runs tests, and iterates on failures without waiting for you. The bottleneck is the supervisor's ability to see the whole board: which agents are productive, which are stuck, where the critical path runs, and what just opened up.
A real-time visual dashboard converts that from an investigation (run five commands, read the output, hold the state in your head) into a scan (look at the screen). That difference compounds across a full workday of parallel agent coordination.
Getting started
Install Beadbox with Homebrew:
brew tap beadbox/cask && brew install --cask beadbox
If your agents already use beads, Beadbox detects existing .beads/ workspaces automatically. Open the app and your issues are there. No import step, no account creation, no cloud sync. Your data stays on your machine.
If you're new to beads, install the CLI (go install github.com/steveyegge/beads/cmd/bd@latest), run bd init in your project, and start dispatching work to your agents. Beadbox shows everything they do the moment they do it.
Beadbox runs on macOS, Linux, and Windows. It's free while in beta.
Try it yourself
Start with beads for the coordination layer. Add Beadbox when you need visual oversight.
Free while in beta. No account required. Works natively with Dolt.