# Beadbox
> Beadbox is a native desktop GUI for the beads issue tracker. It gives developers a visual view of the work their AI coding agents are doing: dependency graphs, epic progress trees, and real-time updates across an agent fleet. Built on Tauri (not Electron). macOS, Linux, and Windows.
Beadbox is the GUI. The underlying issue tracker is **beads** (the `bd` CLI), created by Steve Yegge: https://github.com/steveyegge/beads. Beads stores every issue ("bead") in a local Dolt database — a SQL database with Git-like version control — so issue data is local-first and never leaves the machine unless the user pushes to a Dolt remote.
Typical user: a developer running one or more AI coding agents (Claude Code, Cursor, etc.) who needs a real-time view of what the agent fleet is doing, where work is blocked, and how epics are progressing. The CLI (`bd`) is faster for creating and closing single issues; Beadbox is for seeing the whole picture.
## Install
- Homebrew (macOS): `brew install --cask beadbox/beadbox/beadbox`
- Requires the beads CLI first: `brew install beads`
- All downloads: https://beadbox.app/en/#download
## Product pages
- [Homepage](https://beadbox.app/en): Product overview, hero, features.
- [Beads GUI](https://beadbox.app/en/beads-gui): What Beadbox shows that the CLI can't. Dependency graphs, epic progress, live updates.
- [Beads Dashboard](https://beadbox.app/en/beads-dashboard): Real-time fleet view for teams running multiple AI coding agents.
- [Local-First Issue Tracker](https://beadbox.app/en/local-first-issue-tracker): Privacy and Dolt-backed positioning. No cloud, no accounts, no telemetry on issue data.
## Documentation
- [Getting Started](https://beadbox.app/en/docs/getting-started): Install the bd CLI and Beadbox, open your first workspace. Full quickstart.
- [Core Concepts](https://beadbox.app/en/docs/concepts): The beads data model — workspaces, beads, epics, dependencies, comments.
- [Agent Setup](https://beadbox.app/en/docs/agent-setup): Wiring AI coding agents (Claude Code, etc.) to bd so they create and update issues.
- [Custom Statuses](https://beadbox.app/en/docs/custom-statuses): Define workflow states beyond the five built-in statuses (open, in_progress, blocked, deferred, closed).
- [Keyboard Shortcuts](https://beadbox.app/en/docs/keyboard-shortcuts): Full keyboard-driven navigation reference.
- [Connecting to a Dolt Server](https://beadbox.app/en/docs/connecting-dolt-server): Multi-writer setup against a shared Dolt SQL server.
## Core blog posts
- [Why We Built Beadbox](https://beadbox.app/en/blog/why-we-built-beadbox): Motivation and origin story.
- [I Ship Software with 13 AI Agents](https://beadbox.app/en/blog/coding-with-13-agents): Concrete description of a multi-agent development workflow that depends on beads for coordination.
- [Why Project Management Tools Don't Work for AI Agents](https://beadbox.app/en/blog/why-project-management-tools-dont-work-for-ai-agents): Argument for why Jira/Linear/GitHub Issues fall short when agents are the primary writers.
- [Visualizing Dependencies Between AI Agents in Real Time](https://beadbox.app/en/blog/visualizing-dependencies-between-ai-agents-real-time): How Beadbox's dependency graph surfaces blockers across a fleet.
## Policies
- [Privacy Policy](https://beadbox.app/en/privacy): What data Beadbox and beadbox.app collect (app-usage analytics only; never issue content).
- [Terms](https://beadbox.app/en/terms): Terms of use.
## Optional
- [Local-First Issue Tracking with Dolt](https://beadbox.app/en/blog/local-first-issue-tracking-dolt-cli-integration): Deep dive on why Dolt is the right backing store for a local-first issue tracker.
- [Spec-Driven Development with Claude Code](https://beadbox.app/en/blog/spec-driven-development-claude-code): Workflow for writing specs before code when driving agents through beads.
- [How to Manage Tasks for Claude Code Agents](https://beadbox.app/en/blog/manage-tasks-claude-code-agents): Practical guide to using beads as the task queue for Claude Code.
- [Keyboard-Driven Triage & Visual Issue Tracking](https://beadbox.app/en/blog/keyboard-driven-triage-visual-issue-tracking): Power-user triage patterns in the Beadbox UI.
- [Linear Alternatives: Local-First Issue Tracking](https://beadbox.app/en/blog/linear-alternatives-local-first-issue-tracking): Comparison with cloud issue trackers.
- [beads v1: The Hard Way](https://beadbox.app/en/blog/beads-v1-the-hard-way): Engineering notes from the v1 release of the bd CLI.
- [How to Monitor Multiple Claude Code Agents](https://beadbox.app/en/blog/how-to-monitor-multiple-claude-code-agents): Operational guide for running an agent fleet.
- [Triage Blocked Tasks in Parallel Development](https://beadbox.app/en/blog/triage-blocked-tasks-parallel-development): Using the blocked-bead view to unblock agents quickly.
---
# Full blog content
The sections below contain the complete markdown body of every post on the Beadbox blog, ordered newest first. Each section starts with `## {title}`, followed by publication metadata and the post body.
## v0.24.0: Goodbye Standalone Dolt
Published: 2026-04-16 · URL: https://beadbox.app/en/blog/v0-24-0-simplified-install
For a while now, getting Beadbox running meant installing Dolt separately, then the beads CLI, then Beadbox itself, then hoping the versions lined up. It worked, but it was a lot to ask for something that's supposed to just show you your issues. As of v0.24.0, Dolt is bundled into the beads CLI directly. If you have `beads` installed, you have everything you need.
The new flow is three commands: `brew install beads`, then `bd init` in your project, then `brew install --cask beadbox`. That's it. No Homebrew tap for Dolt, no matching versions, no standalone server process to babysit. Under the hood, beads v1.0.1 ships with an embedded Dolt engine that Beadbox connects to through the same CLI you were already using. The bump to BD_MIN_VERSION 1.0.1 is what unlocks this, so older beads installs will see a friendly prompt to upgrade.
If you're on a team that was running a shared Dolt server for sync, nothing changes. Server mode is still there and still works the same way. We just stopped asking solo users to set one up locally when the embedded engine covers what they need. For most people, this is one fewer thing to install, one fewer process in Activity Monitor, and one fewer thing that can drift out of sync.
Upgrade with `brew upgrade beads-ui` or grab a fresh install from [beadbox.app](https://beadbox.app). Release notes live in [the announcement discussion](https://github.com/beadbox/beadbox/discussions/19).
## v0.23.1: Flock Errors, Sidecar Crashes, and a Windows Path Bug
Published: 2026-04-15 · URL: https://beadbox.app/en/blog/v0-23-1-patch-embedded-reliability
If you've been running Beadbox alongside the bd CLI in embedded mode, you've probably seen flock errors. The embedded Dolt backend uses exclusive file locks, and when both Beadbox's polling and your terminal commands compete for the same lock, one of them loses. In v0.23.1, we added a 2-second debounce to Beadbox's change detection and expanded the retry window. The lock contention that caused those errors should be gone.
There was also a failure mode that Windows users noticed first, though it wasn't platform-specific: when the Node.js backend process died mid-session, Beadbox just kept rendering the last known state. No error message, no indication anything was wrong. You'd click around, eventually hit "Failed to fetch," and have no option except restarting the whole app. We added a sidecar health monitor that catches backend crashes and shows a recovery screen with a one-click restart.
[@red-dot-camel](https://github.com/red-dot-camel) filed [#17](https://github.com/beadbox/beadbox/issues/17) with a clear reproduction path for a Windows-specific issue: workspaces living on non-home drives would lose their connection on every tab switch. Detailed enough that we reproduced and patched it the same day. Bug reports like this one save us weeks of guessing.
Upgrade with `brew upgrade beads-ui` or download from [beadbox.app](https://beadbox.app). Full release notes in [the announcement discussion](https://github.com/beadbox/beadbox/discussions/18).
## We Shipped beads v1.0.0 Support. It Took a Rollback, a Flock Bug, and 6 Hotfixes.
Published: 2026-04-03 · URL: https://beadbox.app/en/blog/beads-v1-the-hard-way
On April 2, beads shipped v1.0.0. The headline feature was embedded Dolt: a zero-config backend that runs the database in-process, no separate server to manage. For solo developers, this was the promise of `bd init` and you're done. No ports, no daemons, no configuration.
We started adding support in Beadbox immediately. Six hotfix releases, a public rollback, and a deep dive into bd's source code later, we came out the other side with a resilience layer we probably should have built months ago.
## The morning before everything broke
The day started clean. We'd been running a dead code hunt across the codebase and shipped v0.20.0 with 5,350 lines removed and a 2-second improvement on cold launch. Forty-two beads closed. A good morning.
Then we upgraded bd to 0.63.3, the first release built on beads v1.0.0's embedded Dolt backend.
Beadbox couldn't find the database. Embedded mode stores data in `.beads/embeddeddolt/` instead of `.beads/dolt/`. The database name changed too, from hardcoded `beads` to a project prefix read from `metadata.json`. And `bd sql`, which our WebSocket server used for O(1) change detection via `DOLT_HASHOF_TABLE`, isn't supported in embedded mode at all.
Three assumptions broken in the first ten minutes.
## Six releases in one day
Discover, fix, ship, discover again.
**v0.20.1** added credential persistence using the OS keychain (six beads worth of work already in progress), fixed a custom status filter bug, and patched Windows-specific issues.
**v0.20.2** taught Beadbox to read `dolt_database` from `metadata.json` so it could find the renamed database.
**v0.20.3** added embedded mode guards. Every `bd sql` call got wrapped with a check: if we're in embedded mode, fall back to CLI-based polling instead of direct SQL queries. The `getDoltDir` function learned to look in `embeddeddolt/` first.
**v0.20.4** fixed `--db` path normalization for the embedded layout. Paths that worked with the old directory structure broke with the new one.
Each fix revealed the next problem.
## The flock
After v0.20.4, we thought we were stable. Then we ran a simple concurrency test: five `bd list` calls at the same time.
Four of them failed.
Embedded Dolt acquires an exclusive file lock (flock) on the database for the entire lifetime of every command. From `PersistentPreRun` to `PersistentPostRun`, nothing else can touch it. This is by design. Without it, concurrent engine initialization causes a nil-pointer panic ([beads#2571](https://github.com/steveyegge/beads/issues/2571)). The flock prevents the crash. But it also means that in embedded mode, bd is effectively single-process.
Beadbox is not single-process. Our WebSocket server polls for changes every second. The UI fires multiple server actions on page load. A user clicking through the app while the background poller runs will generate concurrent bd calls. The flock blocks all of them except the first.
The DoltHub blog post about the embedded implementation described the intended behavior: concurrent callers should "queue up naturally with exponential backoff." But arch reviewed the shipped source code and found that bd uses `TryLock` with `LOCK_NB` (non-blocking). It doesn't wait. It fails immediately. There are two lock layers: bd's flock at the top, and Dolt's driver-level backoff underneath. The first layer short-circuits the second. The retry logic exists in the codebase, but it never executes because the flock rejects the connection before Dolt's backoff gets a chance to run.
The fix (shared locks for read operations via `FlockSharedNonBlock`) exists in bd's source. It just isn't wired up yet.
## We rolled back
We could keep shipping hotfixes against a moving target, or pull back and build a proper resilience layer. We pulled back.
All v0.20.x releases came down from the public repo. v0.19.0 went back up as the recommended version. We posted [a discussion](https://github.com/beadbox/beadbox/discussions/10) explaining what happened and what to do, and added a banner to beadbox.app. Thirty minutes from decision to done.
Every hour a broken release stays up is an hour where someone downloads it, hits the flock issue, and blames the product. We'd rather explain a rollback than debug someone else's bad first experience.
## We weren't the only ones
While we were debugging, a beads user named Kevin posted [beads#2938](https://github.com/steveyegge/beads/issues/2938): "Beads feels painful to use." He'd spent 9.5 hours debugging issues that included the exact embedded-to-server confusion we were hitting. The upgrade to v1.0.0 had silently switched his workspace from server mode to embedded mode ([beads#2949](https://github.com/steveyegge/beads/issues/2949)), hiding his existing issues behind a fresh empty database.
9.5 hours. An experienced user, not someone new to the tool. If that's the experience for someone who knows beads well, the problem isn't the user. It's the migration path.
## What we built for v0.21.0
Instead of patching around individual failures, we built a layer that treats lock contention as a normal operating condition.
**Flock retry with exponential backoff.** Every bd CLI call retries up to 5 times, 100ms to 1.6 seconds between attempts. Lives in one place in `lib/bd.ts`, so every command gets it for free. This covers the common case: two calls collide, one waits briefly, both succeed.
**Graceful degradation UI.** Lock contention no longer means an error screen. The app shows stale data with a refresh indicator. If contention persists past 30 seconds, an amber banner explains the situation. When the lock clears, the banner disappears and data refreshes automatically.
**Auto-promote suggestion.** Repeated contention triggers a suggestion to migrate to server mode: backup, reinitialize with `--server`, restore. One click. This is the right answer for anyone running Beadbox alongside other bd consumers, and now the app tells you that instead of making you figure it out.
**Embedded mode detection.** `getDoltDir` checks for `embeddeddolt/` and routes accordingly. `bd sql` calls are guarded. The WebSocket pipeline falls back to CLI-based polling in embedded mode (slower, but respects the single-process constraint).
## What we learned
**Embedded Dolt is single-process by design.** Not a bug. The flock prevents real panics. Any tool consuming a beads workspace concurrently needs to serialize access or run in server mode. For Beadbox, server mode is the right default. Embedded works for light usage with the retry layer absorbing the occasional collision.
**The docs described intent, not implementation.** The DoltHub blog said backoff. The code said `TryLock` with `LOCK_NB`. We spent time assuming concurrent reads should work because the documentation said they would. Reading the source resolved the confusion in minutes. When behavior doesn't match docs, read the code.
**Test concurrency before you ship.** We didn't run concurrent bd calls until after v0.20.4 was public. `for i in {1..5}; do bd list & done; wait` would have caught the flock issue before any release. Five seconds of testing would have saved us a rollback.
**Roll back early.** The instinct to keep pushing forward is strong. You're close, you can see the fix, one more release. But every broken release that stays public is a trust withdrawal you can't easily undo. Pulling back to v0.19.0 gave us room to build the resilience layer properly instead of shipping it in panicked increments.
**Check your environment variables.** We lost hours to `BEADS_DIR` pointing bd at the wrong workspace. bd was discovering a different database than the one Beadbox was monitoring, and the symptoms looked like data corruption. If your bd commands return unexpected results, `env | grep BEADS` before anything else.
## Where things stand
v0.21.0 is out with beads v1.0.0 support, the resilience layer, and credential persistence via the OS keychain. The [release discussion](https://github.com/beadbox/beadbox/discussions/11) has the full details.
If you're on beads v1.0.0 with embedded mode and hitting intermittent failures, v0.21.0's retry layer should handle it. If you're running Beadbox alongside other tools that hit the same workspace, switch to server mode. The auto-promote flow makes it one click.
And if you're Steve or anyone on the beads team reading this: shared flocks for reads would fix the root cause upstream. [beads#2939](https://github.com/steveyegge/beads/issues/2939) (Unix domain sockets) would make local connections cleaner too. We'll keep building around whatever ships.
## Local-First Issue Tracking with Dolt
Published: 2026-03-07 · URL: https://beadbox.app/en/blog/local-first-issue-tracking-dolt-cli-integration
Every issue tracker you've used follows the same pattern. There's a cloud service. It has a web UI. Someone builds a CLI that talks to the cloud API. The CLI is a second-class citizen: slower, less capable, always one API version behind.
Now flip that architecture. Start with the CLI. Make it write to a local database. Make the database version-controlled, with the same branching and merging semantics you use on source code. Then put a native desktop app on top that reads the same database files directly, no API in between.
That's what [beads](https://github.com/steveyegge/beads) and [Beadbox](https://beadbox.app) do. And the reason this architecture exists is AI agents.
## The problem: agents can't click buttons
If you're coordinating a fleet of AI agents (code generators, reviewers, testers, deployers), you need them to create issues, update statuses, and read work queues. They can't authenticate to Jira. They can't navigate Linear's UI. They need a CLI that writes to a local database, fast, with zero network dependencies.
beads is that CLI. It's an open-source, Git-native issue tracker designed for exactly this workflow. The `bd` command creates, updates, lists, and closes issues. Every write lands in a local [Dolt](https://www.dolthub.com/) database inside your repository's `.beads/` directory.
The numbers matter here. `bd create` takes roughly 15ms. `bd list` across 10,000 issues returns in about 200ms. These benchmarks come from the [beads test suite](https://github.com/steveyegge/beads/blob/main/BENCHMARKS.md). When agents are burning through work items in tight loops, milliseconds per operation determine whether your issue tracker keeps up or becomes the bottleneck.
## Why Dolt, not SQLite?
Dolt is a SQL database that implements Git semantics. Every write is a commit. You get `dolt diff` to see what changed between two points. You get `dolt log` for full audit history. You get `dolt branch` and `dolt merge` with the same mental model you already use on code.
For issue tracking, this means your project history has two parallel audit trails: git log for code changes, dolt log for issue changes. You can answer questions like "what did the issue database look like when we tagged v2.1.0?" by checking out that point in Dolt history. You can branch your issue database to experiment with a reorganization, then merge it back or throw it away.
beads removed SQLite support in v0.9.0 and went all-in on Dolt. The version control semantics aren't a nice-to-have; they're the foundation. When twenty agents are writing to the same issue database, you want the ability to diff, branch, and merge that data with the same confidence you have in your source control.
Optional collaboration works through DoltHub. Push your issue database to a remote, pull changes from teammates. Same push/pull workflow as Git, applied to structured data.
## The visual layer: Beadbox
Agents thrive with CLIs. Humans don't, at least not when they need the big picture. Dependency graphs, epic progress trees, blocked-issue chains: these are spatial problems that a terminal can't render well.
Beadbox is a native desktop application built with Tauri (not Electron) that reads the same `.beads/` directory the CLI writes to. There's no import step, no sync process, no API layer. The GUI watches the filesystem via `fs.watch()`, detects Dolt database changes, and broadcasts updates over a local WebSocket. When an agent runs `bd update BEAD-42 --status in_progress`, the status badge changes in Beadbox within milliseconds.
Here's what the workflow looks like in practice:
```bash
# An agent creates an issue
bd create --title "Migrate auth to OIDC" --type task --priority 1
# Another agent claims it
bd update BEAD-42 --claim --actor agent-3
# A human opens Beadbox and sees the full board:
# dependency graphs, epic trees, filter by status/priority/assignee
# No commands needed. Just look.
# The agent finishes and marks it for review
bd update BEAD-42 --status ready_for_qa
# Beadbox updates in real time. The QA agent picks it up.
```
Agents write through the CLI. Humans read through the GUI. Both operate on the same local Dolt database. No reconciliation, no stale caches, no "let me refresh."
Beadbox runs on macOS, Linux, and Windows. It supports multiple workspaces, so you can switch between projects without restarting.
## What "local-first" actually means
The term gets overused. Here's what it means concretely for beads and Beadbox:
**No account.** You don't sign up for anything. Install the CLI, install the app, point it at a directory. Done.
**No cloud dependency.** Everything runs on your filesystem. Your data never leaves your machine unless you explicitly `dolt push` to a remote. Internet goes down? Nothing changes. You keep working.
**No server.** There's no daemon to manage, no Docker container to run. The Dolt database is a directory of files. The CLI reads and writes those files. Beadbox watches those files.
**Optional collaboration.** When you do want to share, push to DoltHub. Your teammates pull. Merge conflicts on issue data resolve the same way they do on code. But this is opt-in, not required.
Compare this to the alternatives. Jira needs a server (or Atlassian Cloud). Linear needs an account and an internet connection. GitHub Issues needs a repository on GitHub's servers. Even self-hosted options like Gitea require running a web service.
beads needs a directory. Beadbox needs that same directory and a double-click.
## Who this is for
If you run AI agents that need to coordinate through a shared work queue, and you want humans to monitor and steer that work visually, this stack was built for your workflow.
If you manage projects solo and want version-controlled issue tracking that lives next to your code, without a cloud account, this stack works for that too.
If you need Jira's enterprise permission model or Linear's collaborative real-time editing across a distributed team, this isn't the right tool. beads is local-first by design. That's a tradeoff, not an oversight.
## Get started
Install the beads CLI from [github.com/steveyegge/beads](https://github.com/steveyegge/beads), then install Beadbox:
```bash
brew tap beadbox/cask && brew install --cask beadbox
```
Initialize a beads database in any project:
```bash
cd your-project
bd init
```
Open Beadbox, point it at the directory, and you're looking at your issue board. No signup. No configuration wizard. No "connect your GitHub account" modal.
Beadbox is free while in beta.
## Keyboard-Driven Issue Triage
Published: 2026-03-04 · URL: https://beadbox.app/en/blog/keyboard-driven-triage-visual-issue-tracking
You spend your day in a terminal. You navigate files with vim motions, switch tmux panes with prefix keys, and search your shell history with Ctrl-R. Then you need to triage your backlog, and every project management tool on the planet wants you to reach for the mouse.
Jira needs a click to open an issue. Another click to close the panel. Another to switch projects. Linear is faster, but still fundamentally mouse-first: you point, you click, you scroll. GitHub Issues requires a full page load for every issue you open. These tools were designed for product managers working in browsers, not for developers working in terminals.
The friction is small per interaction and enormous across a day. If you triage 30 issues in a morning, that's 30 reach-for-mouse, click, read, click-close cycles. Your hands leave the keyboard 60 times for what should be a sequential scan through a list.
We built [Beadbox](https://beadbox.app) for developers who think this is absurd.
## The full keyboard triage workflow
Beadbox is a native desktop app (built on [Tauri](https://tauri.app/), not Electron) that renders a real-time visual dashboard for the [beads](https://github.com/steveyegge/beads) issue tracker. It shows you epic trees, dependency badges, status filters, and progress bars. And you can navigate all of it without touching the mouse.
Here's what a triage session looks like:
1. **Open Beadbox.** Your most recent workspace loads automatically. Issues appear in a table with status badges, priority indicators, and assignee columns.
2. **Press `j` to move down the list.** Press `k` to move up. These are vim-style motions, the same muscle memory you already have. The selection highlight tracks your position.
3. **Press `Enter` to open the detail panel.** The selected issue expands into a side panel showing the full description, comments, dependencies, and metadata. You read it without losing your place in the list.
4. **Press `Escape` to close the panel.** You're back in the list, cursor exactly where you left it. Press `j` to move to the next issue.
5. **Press `/` to search.** A search bar appears. Type a keyword or issue ID, and the list filters instantly. Press `Escape` to clear the search and return to the full list.
6. **Use arrow keys on epic trees.** When you're viewing an epic with nested children, left and right arrows collapse and expand tree nodes. `h` and `l` also work (vim-style horizontal navigation). You scan through a 15-issue epic without clicking a single disclosure triangle.
That's it. `j/k` to move, `Enter` to open, `Escape` to close, `/` to search, arrow keys to expand trees. Five keys cover 90% of triage navigation.
If you spot an issue that needs a status change or priority bump during triage, you drop to the terminal:
```bash
bd update bb-f8o --status in_progress --priority 1
```
Beadbox picks up the change within milliseconds (via filesystem watch and WebSocket) and re-renders. You see the updated status badge without refreshing or clicking anything. Then you press `j` and keep moving.
## Why reads and writes are split on purpose
This is the part where most GUI tools get it wrong. They try to handle everything: reading issues, editing fields, changing statuses, managing dependencies. The result is forms. Lots of forms. Dropdown menus for status. Text inputs for descriptions. Modal dialogs for dependency management. Every one of those interactions requires clicking.
Beadbox took a different approach. It's a read-heavy interface. The CLI handles writes.
The [beads CLI](https://github.com/steveyegge/beads) (`bd`) is already the source of truth for your issue data. Agents use it. Scripts use it. Your automation uses it. Building a second write path through a GUI creates a synchronization problem and doubles the surface area for bugs.
Instead, Beadbox optimizes ruthlessly for comprehension and navigation. It answers the questions that terminals are worst at: What does the full epic tree look like? Which issues are blocked, and on what? How far along is this feature? What changed in the last hour? These are visual questions. Flat text output from `bd list` can technically answer them, but a collapsible tree with progress bars answers them in a glance.
The keyboard shortcuts exist to make that glance fast. You scan, you read, you understand. When you need to act, you type a `bd` command. Two tools, each doing what it's best at.
## Switching workspaces without losing context
If you work on multiple projects, each with its own beads database, workspace switching becomes a daily friction point. In most project management tools, switching projects means navigating to a different URL, logging into a different workspace, or opening a new browser tab. Your filters reset. Your scroll position resets. You lose the mental context you had in the previous project.
Beadbox handles this differently. A dropdown in the header lists every detected workspace. Click it (or navigate to it with keyboard), select a different project, and the entire view reloads from that project's database. The critical detail: filters and scroll position persist per workspace. When you switch back, everything is exactly where you left it.
The detection is automatic. Beadbox scans `~/.beads/registry.json` for registered workspaces and discovers directories containing `.beads/` databases. Add a new project, run `bd init` in it, and the next time you open Beadbox it appears in the dropdown. No import, no configuration screen, no "add workspace" wizard.
For developers who maintain multiple services or manage agents across several repositories, this turns Beadbox into a single pane across all active work. The alternative is multiple terminal windows, each running `bd list` against a different `--db` path, and keeping track of which window points at which project in your head.
## How the alternatives compare
Every major project management tool requires mouse interaction for basic navigation:
**Jira** has keyboard shortcuts (`j`/`k` exist), but they navigate between issues in a list view that still requires clicking to open details, clicking to switch projects, and clicking through deeply nested menus to manage epics. The shortcuts feel bolted on rather than foundational.
**Linear** is the closest to keyboard-friendly among SaaS tools. It has `Cmd+K` for command palette and some navigation shortcuts. But workspace switching still means clicking through a sidebar menu, and the command palette is a search-first interaction model, not a scan-first one. You need to know what you're looking for. Triage is about scanning what you don't know yet.
**GitHub Issues** has no meaningful keyboard navigation for triage. You click an issue to open it (full page load), click the back button to return, and repeat. Switching between repositories is a URL change. There's no keyboard-driven scan of a backlog.
**Beadbox** was designed around keyboard triage from the start. The shortcuts aren't an afterthought layered on top of a mouse-first UI. The entire navigation model assumes your hands stay on the keyboard. The mouse works too (everything is clickable), but it's the fallback, not the primary interaction.
## What you're actually comparing
The real difference isn't "which tool has more keyboard shortcuts." It's the interaction model.
Mouse-first tools optimize for discoverability. Every action has a visible button. That's great for onboarding and for non-technical users who need to find features. It's terrible for speed once you know what you're doing.
Keyboard-first tools optimize for throughput. Once you learn `j/k/Enter/Escape`, you triage at the speed of reading, not at the speed of pointing. The tradeoff is a steeper initial learning curve (you need to know the shortcuts exist). For developers who already use vim motions in their editor and terminal, that curve is essentially flat.
Beadbox also makes a tradeoff that SaaS tools can't: it only works with [beads](https://github.com/steveyegge/beads). You don't get Jira's integrations, Linear's cycles, or GitHub's pull request links. You get a visual dashboard for a Git-native issue tracker that stores everything locally, runs offline, and lets AI agents read and write issues through Unix pipes. If that's your stack, the keyboard workflow is unmatched. If you need Slack notifications when issues close, this isn't the right tool today.
## Get started
Install Beadbox with Homebrew:
```bash
brew tap beadbox/cask && brew install --cask beadbox
```
If you already use beads, Beadbox detects your `.beads/` workspaces automatically. Open the app and start pressing `j`.
Runs on macOS, Linux, and Windows. Free while in beta.
## Visualizing Dependencies Between AI Agents in Real Time
Published: 2026-03-01 · URL: https://beadbox.app/en/blog/visualizing-dependencies-between-ai-agents-real-time
You have five AI coding agents working a feature epic. Agent 1 is building the API layer. Agent 2 needs that API to wire up the frontend. Agent 3 is writing integration tests that depend on both. Agents 4 and 5 are handling migrations and docs, each blocked on different pieces.
This works for about twenty minutes. Then Agent 2 stalls because Agent 1 hit an unexpected schema problem. Agent 3 is now blocked on Agent 2, which is blocked on Agent 1. Agents 4 and 5 keep churning, but their work can't merge until the chain resolves. You don't find out until you wonder why nothing has shipped in an hour and start running `bd blocked` across every issue.
The dependency information exists. It lives in your issue tracker. But when you manage it through a CLI, you're reconstructing the graph in your head from flat text output. That reconstruction fails at exactly the moment it matters most: when the graph is complex and things are breaking.
## How beads tracks dependencies
[beads](https://github.com/steveyegge/beads) is a git-backed issue tracker built for AI agent coordination. It stores everything in a local Dolt database inside your repo's `.beads/` directory. No cloud service, no accounts, no sync conflicts.
Agents declare dependencies with a single command:
```bash
bd dep add ISSUE-42 ISSUE-37
```
This records that ISSUE-42 depends on ISSUE-37. ISSUE-42 cannot proceed until ISSUE-37 closes. The inverse query is just as simple:
```bash
bd blocked
```
That returns every issue in the workspace currently blocked by an unresolved dependency. And for a specific issue:
```bash
bd dep list ISSUE-42
```
This shows what ISSUE-42 depends on and what depends on ISSUE-42.
The data model is clean. The problem isn't recording dependencies. The problem is seeing them. When you have 30 active issues across five agents, running `bd blocked` gives you a list. A list doesn't show you that ISSUE-12 is a bottleneck blocking seven downstream tasks across three agents. A list doesn't show you that Agent 3 created a circular dependency chain between ISSUE-18 and ISSUE-22. You need a spatial view of the graph, not a sequential one.
## What Beadbox shows you
[Beadbox](https://beadbox.app) is a native desktop app that wraps the beads CLI with a visual interface. It reads from the same `.beads/` database your agents write to, and it updates in real time as they work.
In the epic tree view, every issue that has unresolved dependencies shows a blocked badge inline. You see the full tree structure of your epic, with blocked issues marked at a glance. No command to run, no output to parse.
The dependency chain is visible spatially. If ISSUE-42 depends on ISSUE-37, and ISSUE-37 depends on ISSUE-15, and ISSUE-15 is assigned to Agent 1 which is stuck, you can trace that chain by scanning the tree. You see the shape of the bottleneck without reconstructing it from separate CLI queries.
The real-time piece matters. When Agent 1 finally closes ISSUE-15, the Beadbox UI reflects it within a second. The blocked badge on ISSUE-37 drops. If ISSUE-37 was the only thing blocking ISSUE-42, that badge drops too. You watch the dependency chain collapse as work completes, without refreshing or re-querying.
Under the hood, this works through a straightforward pipeline: a WebSocket server watches the `.beads/` directory with `fs.watch()`. When any agent writes to the database (closing an issue, adding a dependency, updating status), the filesystem event triggers a broadcast to all connected clients. The React UI re-renders with fresh data. Sub-second latency from agent action to visual update.
## A concrete scenario: spotting a bottleneck
Five agents are working a feature epic with 24 issues. You open Beadbox and look at the epic tree. Twelve issues are in progress. Six show blocked badges.
That's already information you didn't have. `bd list` would show you 12 in-progress issues, but you'd need to run `bd blocked` separately and cross-reference to understand which in-progress issues are actually stalled.
You scan the blocked badges and notice something: four of the six blocked issues all depend on ISSUE-19, a database schema migration assigned to Agent 4. Agent 4 is still working it, but ISSUE-19 has become a single-point bottleneck. Four agents are effectively idle, waiting on one task.
Without the visual view, you might not catch this for another hour. With it, you can intervene immediately. Maybe you reassign ISSUE-19 to a faster agent. Maybe you split it into smaller pieces that can unblock some dependents early. Maybe you realize two of those four dependencies were over-declared and can be removed with `bd dep remove`.
The point isn't that the information was unavailable before. It was always in the database. The point is that the visual representation surfaces patterns that flat text obscures.
## Common dependency anti-patterns
Running multiple AI agents on one repo produces a few recurring dependency problems. All of them are easier to catch visually than through CLI queries.
**Over-declaration.** Agents tend to be conservative. When in doubt, they declare a dependency. The result is a dependency graph that's denser than it needs to be, with issues blocked on work they don't actually need. In Beadbox, you spot this when an issue shows a blocked badge but the blocking issue is in a completely unrelated part of the codebase. A quick `bd dep remove` cleans it up.
**Circular chains.** Agent A declares a dependency on Agent B's work. Agent B, working independently, declares a dependency on Agent A's work. Now both are blocked on each other and neither can proceed. The beads CLI catches obvious circular dependencies at creation time, but indirect cycles through three or more issues are harder to detect. In the epic tree, you notice these as clusters of blocked badges that never resolve, even as other work completes around them.
**Single-point bottlenecks.** One issue accumulates five, six, seven downstream dependents. This happens naturally when agents working in parallel all need the same foundational piece. The scenario above illustrates the pattern. In a list view, you see seven blocked issues. In a tree view, you see seven arrows pointing at the same node. The bottleneck is obvious.
## Getting started
Beadbox runs on macOS, Linux, and Windows. Install it with Homebrew:
```bash
brew tap beadbox/cask && brew install --cask beadbox
```
Point it at any repository with a `.beads/` directory. If you're already running beads with your agent fleet, Beadbox picks up the existing database and starts rendering immediately. No import step, no configuration, no account creation.
Your agents keep using the CLI. They run `bd dep add`, `bd update`, `bd close` as usual. Beadbox watches the database and reflects every change in real time. You get the visual layer without changing any agent workflows.
Beadbox is free while in beta.
If you're coordinating multiple AI agents on a single codebase, the dependency graph is the thing that will break your workflow first. You can manage it blind through the CLI, or you can see it. Seeing it is faster.
## Claude Code Multi-Agent Workflow Guide: From 1 to N Agents
Published: 2026-02-28 · URL: https://beadbox.app/en/blog/claude-code-multi-agent-workflow-guide
You've seen the screenshots. Five, ten, fifteen Claude Code agents running in tmux, each one working on a different piece of the same codebase. It looks productive. It looks exciting. And if you've tried to replicate it, you know it looks a lot easier than it is.
Running one Claude Code agent is straightforward. You give it a task, it writes code, you review. Running two is manageable but introduces a new problem: they might step on each other's changes. Running five requires a system. Running ten without a system is chaos with a monthly bill.
This guide is about that system. Not the theory of multi-agent architectures. The actual, practical workflow for running multiple Claude Code agents on a real codebase without everything falling apart.
## Why One Agent Isn't Enough
A single Claude Code agent can handle a surprising amount of work. But it's sequential. While it's implementing a backend endpoint, your frontend sits idle. While it's writing tests, your documentation falls behind. While it's debugging a build failure, three new features wait in the queue.
The math changes when you realize that most software work is parallelizable. A frontend component and a backend API endpoint don't share files. A test suite and a documentation update touch different directories. An architecture review and a bug fix operate on different timescales entirely.
The bottleneck in single-agent development isn't the agent's speed. It's your pipeline depth. One agent means one thing in progress at a time. Multiple agents mean multiple things in progress simultaneously, and that changes what a single developer can ship in a day.
## Work Splitting Strategies
Before you open a second tmux pane, you need to decide how to divide work. Three patterns hold up in practice.
### Split by Component
The simplest approach. Agent A owns `components/`, Agent B owns `server/`, Agent C owns `lib/`. Each agent works in its own territory and never touches files outside it.
This works well when your codebase has clear architectural boundaries. A Next.js app with distinct frontend components, backend actions, and shared libraries splits naturally along those lines.
The limitation: cross-cutting work. A feature that requires changes to the UI, the API, and the database layer doesn't fit neatly into one agent's territory. You handle this by breaking the feature into component-scoped subtasks and sequencing them.
### Split by Role
Instead of dividing by code location, divide by function. One agent writes code. Another writes tests. A third handles documentation. A fourth does code review.
This mirrors how human teams work and produces higher quality output because the test-writing agent doesn't know (or care) how easy the code was to write. It tests against the spec, not against the author's assumptions.
The tradeoff is more coordination overhead. The test agent needs the implementation agent to finish first. The documentation agent needs both. You're managing a pipeline, not just parallel workers.
### Split by Lifecycle Stage
A more sophisticated version of role splitting. One agent brainstorms and plans. Another implements. A third verifies. The work flows through stages, and each agent is specialized for its stage.
This is the pattern we use at [Beadbox](https://beadbox.app). Our architect agent designs, our engineering agents implement, our QA agents verify independently. The same task flows through multiple specialists, and each one adds a layer of quality that generalist agents miss. I wrote about the full setup in [I Ship Software with 13 AI Agents](/blog/coding-with-13-agents).
The right strategy depends on your project. Small projects with clear file boundaries do well with component splitting. Larger projects where quality matters benefit from role or lifecycle splitting. Most teams end up with a hybrid.
## The CLAUDE.md Identity Pattern
Here's where theory meets implementation. Each Claude Code agent gets its own `CLAUDE.md` file, and this file is the single most important piece of the multi-agent system.
A `CLAUDE.md` defines four things:
1. **What the agent is.** Its role, specialty, and domain.
2. **What it owns.** The files, directories, or responsibilities it controls.
3. **What it must not touch.** The explicit boundaries that prevent conflicts.
4. **How it communicates.** The protocols for reporting work and coordinating with other agents.
Here's a real example. Two Claude Code agents with complementary scopes:
```markdown
# CLAUDE.md for Agent: frontend-eng
## Identity
Frontend engineer. You implement UI components, pages, and client-side
logic. You own everything under components/, app/, and hooks/.
## File Ownership
- components/** (you own these)
- app/** (you own these)
- hooks/** (you own these)
- lib/utils.ts (shared, read-only for you)
- server/** (DO NOT MODIFY — owned by backend-eng)
## Communication
When you need a backend change, create a task describing what API
you need. Do not implement it yourself.
When done with a task, comment: "DONE: . Commit: "
```
```markdown
# CLAUDE.md for Agent: backend-eng
## Identity
Backend engineer. You implement server actions, API routes, and
data layer logic. You own everything under server/, actions/, and lib/.
## File Ownership
- server/** (you own these)
- actions/** (you own these)
- lib/** (you own these, except utils.ts is shared)
- components/** (DO NOT MODIFY — owned by frontend-eng)
- app/** (DO NOT MODIFY — owned by frontend-eng)
## Communication
When you change a data type in lib/types.ts, notify frontend-eng
by commenting on the relevant task.
When done with a task, comment: "DONE: . Commit: "
```
Notice the explicit "DO NOT MODIFY" lines. Without these, agents drift. They see an opportunity to "help" by fixing a typo in a file they don't own, and suddenly you have merge conflicts. Or worse, they silently refactor code that another agent was depending on.
The identity section isn't decoration. Claude Code reads `CLAUDE.md` at the start of every session and uses it to scope its behavior. An agent told it's a "frontend engineer" will naturally resist making backend changes. An agent told it owns specific directories will ask before modifying files outside those directories.
## Avoiding Merge Conflicts
File-level ownership, as shown in the CLAUDE.md examples above, is the first line of defense. But it's not the only one.
**Commit and push frequently.** An agent that works for 45 minutes without committing is building up a merge conflict time bomb. Instruct agents (in their CLAUDE.md) to commit after completing each logical unit of work.
**Pull before starting new work.** Each agent should `git pull --rebase` before beginning a new task. This is trivially easy to enforce by adding it to the agent's startup protocol in CLAUDE.md.
**Use feature flags for cross-cutting work.** When two agents need to modify the same file, the safer approach is often to have one agent create the interface or flag, commit and push, then have the second agent pull and build on top of it. Sequential beats parallel when the alternative is a merge nightmare.
**Separate branches for risky work.** If an agent is doing something experimental, give it its own branch. This is especially useful for architecture spikes or refactoring work that might not land.
In practice, the combination of file ownership rules and frequent commits eliminates 90% of merge conflicts. The remaining 10% happen in shared files like `types.ts` or `package.json`, and they're usually trivial to resolve.
## Agent-to-Agent Communication
Claude Code agents can't talk to each other directly. There's no shared memory, no message bus, no real-time channel between them. This is actually a good thing. Direct communication between agents creates coupling, race conditions, and debugging nightmares.
Instead, communication happens through artifacts. Three patterns work:
### Task Comments
The most reliable pattern. Agent A finishes work and comments on a shared task: "DONE: implemented the /api/users endpoint. Returns JSON. Schema is in lib/types.ts." Agent B reads the task comment and knows exactly what's available.
### Status Updates
Each task has a status: open, in_progress, done, blocked. When Agent A marks a prerequisite task as done, Agent B (or you, or a coordinator) knows the dependent work can start.
### File Changes
The simplest form. Agent A writes a TypeScript interface to `lib/types.ts` and commits. Agent B pulls and sees the new types. No explicit communication needed because the code itself is the message.
What does NOT work: trying to build a real-time message-passing system between agents. If you need Agent A to wait for Agent B's output, model that as a dependency between tasks, not as a synchronous call.
## The Dispatch Loop
Someone needs to run the show. In a multi-agent Claude Code setup, there are two options: you do it manually, or you designate a coordinator agent.
### Manual Dispatch
You maintain a task list. You assign tasks to agents. You check progress. You handle blockers. This works up to about five agents before the coordination overhead starts eating into the productivity gains.
A typical manual dispatch cycle looks like this:
1. **Morning:** Review what's in progress, what's blocked, what's ready for work
2. **Assign:** Send each agent its next task with context
3. **Monitor:** Every 10-15 minutes, check agent output for signs of being stuck
4. **Unblock:** When an agent hits a problem, intervene or reassign
5. **Close out:** At end of day, review what shipped and queue tomorrow's work
In tmux, this looks like cycling through panes, reading recent output, and deciding what each agent needs next. Tools like `gp` (peek at an agent's recent output without interrupting it) help, but you're still the bottleneck.
### Coordinator Agent
Dedicate one Claude Code agent to dispatching work to the others. This agent doesn't write code. It reads the task backlog, assigns work to available agents, checks on progress, and handles the dispatch loop programmatically.
This is the pattern we use. Our "super" agent runs a patrol loop: every few minutes, it peeks at each active agent, checks task statuses, identifies blockers, and dispatches new work when an agent goes idle. The human (me) makes the priority calls and resolves ambiguous situations. Super handles the logistics.
A coordinator agent needs its own CLAUDE.md:
```markdown
# CLAUDE.md for Agent: super
## Identity
Dispatch coordinator. You assign work to agents, monitor progress,
and ensure the pipeline keeps moving. You do NOT write code.
## Responsibilities
- Maintain awareness of all active tasks and their statuses
- Assign ready tasks to idle agents
- Monitor agent progress every 5-10 minutes
- Escalate blockers to the human when agents can't self-resolve
- Verify agents follow the protocol: plan before code, test before done
## Communication
- To assign work: message the agent with task ID and priority
- To check progress: peek at agent's recent output
- To escalate: message the human with context and options
```
The coordinator pattern scales much better than manual dispatch. At 10+ agents, manual coordination is a full-time job. A coordinator agent handles the routine logistics and only escalates the decisions that require human judgment.
## Tmux Layout for Multi-Agent Work
The physical layout matters more than you'd think. Here's a tmux configuration that works for running multiple Claude Code agents:
```bash
# Create a new tmux session
tmux new-session -s agents -n super
# Split into panes for each agent
tmux split-window -h -t agents:super
tmux split-window -v -t agents:super.1
# Or create named windows (easier to manage at scale)
tmux new-window -t agents -n eng1
tmux new-window -t agents -n eng2
tmux new-window -t agents -n qa1
tmux new-window -t agents -n frontend
tmux new-window -t agents -n backend
```
Named windows beat split panes once you pass four agents. You can't read five panes on a single screen, but you can quickly switch between named windows. The naming convention matters too. `eng1`, `eng2`, `qa1` are instantly scannable. `agent-1`, `agent-2`, `agent-3` tell you nothing.
Start each agent in its own working directory with its own CLAUDE.md:
```bash
# In the eng1 window
cd ~/project
claude --claude-md ./agents/eng1/CLAUDE.md
# In the qa1 window
cd ~/project
claude --claude-md ./agents/qa1/CLAUDE.md
```
One practical tip: keep a "dashboard" window that's just a shell. Use it to run `git log --oneline -10`, check task status, or peek at agents without interrupting their work. This becomes your command center.
## When Things Go Wrong
Multi-agent workflows fail in predictable ways. Knowing the failure modes saves you from learning them the hard way.
**Two agents edit the same file.** Usually because the file ownership in CLAUDE.md wasn't specific enough. `lib/utils.ts` is a classic conflict magnet. Solution: either assign shared utility files to one specific agent, or make them read-only for everyone and route changes through a single owner.
**An agent goes silent.** It hit a rate limit, an error loop, or just got stuck in a deep chain of reasoning. Check the output. If it's retrying the same failing command, kill the session and restart with clearer instructions. Periodic health checks (every 10-15 minutes) catch this before you lose an hour.
**Context windows fill up.** Long-running agents accumulate context and start performing worse. Each agent's CLAUDE.md should include a protocol for this: "If you've been working for more than 90 minutes, save your state and request a fresh session." In practice, this means having the agent commit its work, note where it left off, and starting a new Claude Code session that picks up from that commit.
**Work drifts from the spec.** Agent builds something that technically works but doesn't match what was asked for. The fix is the plan-before-code pattern: before writing any code, the agent comments its implementation plan. You review the plan in 60 seconds and catch misunderstandings before they become 500-line diffs.
**The pipeline stalls.** Agent B is waiting on Agent A, but Agent A is waiting on a decision from you. Meanwhile Agent C finished its work 30 minutes ago and has been idle. This is a coordination failure, not a technical one. The coordinator agent (or you) needs to keep the pipeline moving by monitoring blockers and reassigning idle agents.
## How We Solved This with Beads
Everything above works with sticky notes and good intentions. But around five agents, the informal approach starts cracking. You forget what Agent C was working on. You lose track of which tasks are blocked. You can't remember if the API endpoint Agent B needs was finished or just started.
This is the problem that [beads](https://github.com/steveyegge/beads) solves. Beads is an open-source, local-first issue tracker. Every task is a "bead" with a unique ID, a status, a description, acceptance criteria, dependencies, and a comment thread. All of it accessible through a CLI called `bd`, which means your Claude Code agents can read and write to it without leaving the terminal.
Here's how the dispatch loop looks with beads:
```bash
# See what's ready for work
bd list --status open
# Assign a task to an agent
bd update bb-a1b2 --claim --actor eng1
# Agent reads its assignment
bd show bb-a1b2
# Agent comments its plan before coding
bd comments add bb-a1b2 --author eng1 "PLAN:
1. Add endpoint at /api/users
2. Define UserResponse type in lib/types.ts
3. Write integration test
Files: server/api/users.ts (new), lib/types.ts (modify)
Test: curl localhost:3000/api/users returns 200 with JSON array"
# Agent finishes and comments what it did
bd comments add bb-a1b2 --author eng1 "DONE: /api/users endpoint live.
Returns paginated JSON. Added UserResponse type.
Verification:
1. curl http://localhost:3000/api/users → 200, JSON array
2. curl http://localhost:3000/api/users?page=2 → 200, second page
3. pnpm test → all passing
Commit: 8f3c2a1"
# Agent marks the task done
bd update bb-a1b2 --status closed
```
Every agent follows this protocol: claim, plan, implement, comment DONE, update status. The comment thread on each bead becomes a complete audit trail of what happened, why, and how to verify it.
Dependencies prevent conflicting work:
```bash
# Create a task that depends on another
bd create --title "Build user list component" \
--deps bb-a1b2 \
--description "Frontend component that calls /api/users. Blocked until API is live."
```
The dependent task stays blocked until `bb-a1b2` is done. No agent will pick it up prematurely. No one wastes time building a frontend for an API that doesn't exist yet.
The `bd list` command gives you a snapshot of the entire pipeline:
```bash
bd list --status in_progress
# Shows what every agent is actively working on
bd blocked
# Shows tasks waiting on unfinished dependencies
bd list --status open --priority p1
# Shows the highest-priority work that's ready to start
```
This replaces the mental model you were keeping in your head. The state of every task, every agent's current work, every dependency chain, all queryable from the command line.
## Scaling Visibility
The CLI works. But at scale, there's a limit to how much you can absorb by running `bd list` in a terminal. When you have eight agents working across three epics with seventeen open tasks and a dozen dependencies, you need to see the shape of the work, not just a list of it.
This is the gap we built [Beadbox](https://beadbox.app) to fill. Beadbox is a real-time dashboard that sits on top of beads and shows you:
- **Epic trees** with progress bars, so you see how each feature is progressing across all its subtasks
- **Dependency graphs** that surface blocked work before it stalls the pipeline
- **Agent activity** showing which agent is working on what, with their plan and done comments visible in context
- **Real-time updates** because the dashboard watches your beads database and refreshes as agents update task statuses
Beadbox doesn't replace the CLI. Your agents still read and write to beads through `bd`. Beadbox gives you the big picture so you can make the judgment calls: which epic is falling behind, which agent needs help, where the bottleneck is forming.
It's free during the beta. If you're building workflows like this, star [Beadbox](https://github.com/beadbox/beadbox) on GitHub.
## Getting Started
You don't need thirteen agents to benefit from this. Here's the minimum viable setup:
1. **Two Claude Code agents** in separate tmux windows, each with its own CLAUDE.md defining file ownership boundaries.
2. **A task list** (even a text file works at this scale) so both agents know what they're working on and what's up next.
3. **A commit protocol:** both agents commit frequently and pull before starting new work.
Once that feels natural, add a third agent for testing or documentation. Then consider a coordinator agent. Then adopt beads for structured task tracking. Scale the system as the coordination pain increases, not before.
The hard part isn't the tooling. It's the shift in thinking: from "I'm using an AI assistant" to "I'm running a team." The CLAUDE.md files, the dispatch protocols, the ownership boundaries: these are management practices, not configuration files. You're building an organization, even if the team members run on API calls.
Start with two agents and clear boundaries. Everything else follows from there.
## Visual Epic Progress Tracking for Developer Teams
Published: 2026-02-27 · URL: https://beadbox.app/en/blog/visual-epic-progress-tracking-developer-teams
You create an epic with 15 subtasks. You assign them across a handful of agents or teammates. Two days later, someone asks: "How far along is the auth rewrite?"
You run `bd show bb-r4f`. That gives you the epic itself. Title, description, priority. It doesn't tell you how many children are complete. So you run `bd list --parent bb-r4f`. You get a flat list of IDs and titles. To see the status of each one, you pipe through `jq` or run `bd show` on each child individually. Some of those children have their own subtasks. Now you're three levels deep, reconstructing a tree in your head from terminal output.
This works when an epic has three children. It falls apart at ten. And if you're coordinating AI agents that create subtasks, file blockers, and close issues in rapid succession, the CLI output goes stale between the time you run the command and the time you finish reading it.
The problem isn't beads. The [beads CLI](https://github.com/steveyegge/beads) is excellent at structured, scriptable issue management. The problem is that hierarchical progress is a visual concept, and terminals render text in rows.
## What an epic tree looks like in Beadbox
Open [Beadbox](https://beadbox.app), click an epic, and you see its children in a collapsible tree. Each child shows a status badge (open, in_progress, ready_for_qa, closed), a priority indicator, and the assignee. The epic itself displays a progress bar: "9 of 14 complete (64%)." That number updates as children close.
Expand a child that's itself an epic and you see its subtasks nested underneath. The parent's progress aggregates from all descendants, not just direct children. A three-level epic with 40 total issues across engineering, QA, and documentation shows you the real completion percentage at the top, accounting for every leaf node in the tree.
Blocked issues get a distinct visual treatment. If `bb-m3q` depends on `bb-k7p` and `bb-k7p` is still open, the blocked badge sits next to `bb-m3q`'s status. You don't need to run `bd dep list` to discover the bottleneck. It's visible in the tree, at the level where it matters.
Compare this to the CLI workflow. To answer "what's blocking progress on the auth epic," you'd run:
```bash
bd list --parent bb-r4f --status=open --json | \
jq -r '.[].id' | \
xargs -I{} bd show {} --json 2>/dev/null | \
jq -r 'select(.blocked_by | length > 0) | "\(.id) blocked by \(.blocked_by | join(", "))"'
```
That's a perfectly valid pipeline. It returns the right answer. But you have to write it, remember the flags, and re-run it every time you want an update. In Beadbox, the same information is always visible in the tree. No query required.
## Real-time updates: the tree changes while you watch
This is where the visual model earns its keep. When an agent runs `bd update bb-k7p --status=closed` in a terminal, Beadbox picks up the filesystem change within milliseconds. The WebSocket server detects the write to the `.beads/` directory, broadcasts the change, and the React UI re-renders.
In the epic tree, that looks like this: `bb-k7p` flips from an orange "in_progress" badge to a green "closed" badge. The progress bar on the parent epic ticks from 64% to 71%. And `bb-m3q`, which was blocked on `bb-k7p`, drops its blocked indicator and shows as available work.
All of that happens without you running a command or clicking a refresh button. If you're supervising a fleet of agents working through a release epic, you watch the tree fill in as tasks complete. Bottlenecks surface the moment they form because blocked badges appear in real time. Stalled subtrees (clusters of issues that stop changing status) become visually obvious after a few minutes of inactivity against a backdrop of steady progress elsewhere.
The underlying mechanism is straightforward. Beadbox runs a WebSocket server that calls `fs.watch()` on your `.beads/` directory. Every database write triggers a broadcast. The client-side hook receives the signal and re-fetches the relevant server action. No polling interval, no manual refresh. The latency from CLI command to UI update is typically under one second.
## Keyboard-first navigation
Beadbox is a desktop app for developers, and it behaves like one. `j` and `k` move through the issue list (vim-style). `Enter` opens the selected issue in the detail panel. `/` focuses the search bar. `Escape` closes whatever you have open. Arrow keys expand and collapse epic tree nodes.
You can triage an entire backlog without touching the mouse. Move down the list with `j`, open an issue to read its description, press `Escape` to close, move to the next. If you spot something that needs a status change, you still drop to the terminal for mutations (`bd update`). Beadbox is a read-heavy interface by design. The CLI handles writes. The GUI handles comprehension.
This split is intentional. A GUI that tries to replace the CLI for writes ends up building forms for every possible flag combination. A GUI that focuses on reading and navigation can optimize for the thing terminals are worst at: showing hierarchical, cross-referenced data at a glance.
## Multiple projects, one window
If you work across more than one codebase, each with its own `.beads/` database, Beadbox's workspace switcher handles that. A dropdown in the header lists every detected workspace. Click one (or find the workspace with `/` search), and the entire view reloads from that project's database. Filters and scroll position persist per workspace, so switching back doesn't lose your place.
The detection is automatic. Beadbox scans for registered workspaces in the bd configuration and for directories containing `.beads/` databases. Add a new project, initialize beads in it, and the next time you open Beadbox it appears in the dropdown. No import, no configuration screen.
For developers who maintain several services, or for teams where each agent works in a separate repository, this turns Beadbox into a single pane across all active projects. The alternative is multiple terminal windows, each running `bd list` against a different `--db` path.
## What this replaces
Beadbox doesn't replace the CLI. If you script your workflows, pipe `bd list` through `jq`, or have agents that create and close issues programmatically, that all continues to work unchanged. Beadbox reads the same database your scripts write to.
What it replaces is the mental overhead of reconstructing project state from flat text output. The questions that Beadbox answers at a glance, and that the CLI answers only through composed queries:
- How far along is this epic, really?
- What's blocked right now, and on what?
- Which subtasks haven't been touched in hours?
- Are agents making progress, or have they stalled?
These are visual questions. They deserve visual answers.
## Getting started
Beadbox is free during the beta. Install with Homebrew:
```bash
brew tap beadbox/cask && brew install --cask beadbox
```
If you already use [beads](https://github.com/steveyegge/beads), Beadbox detects your `.beads/` workspaces on launch. No import, no account. Open the app, expand an epic, and see where your project actually stands.
Runs on macOS, Linux, and Windows.
## Why Project Management Tools Don't Work for AI Agents
Published: 2026-02-27 · URL: https://beadbox.app/en/blog/why-project-management-tools-dont-work-for-ai-agents
You're running multiple AI coding agents on the same codebase. Maybe three, maybe thirteen. They need to track their own work: create issues, update statuses, check dependencies, report progress. Dozens of writes per minute across the fleet.
This is agentic engineering: humans coordinating fleets of AI agents to ship software. The workflow is new, but the first thing everyone does is reach for the tool they already know. Jira. Linear. GitHub Issues. Notion. Whatever your team uses for project management.
It doesn't work. And the mismatch isn't superficial. It's architectural.
## Latency kills throughput
A Jira API call takes 200-800ms. A Linear API call is faster but still 100-300ms. Creating a single issue, reading its dependencies, updating its status: that's three round-trips through HTTPS, DNS resolution, TLS handshake, and JSON serialization. Call it 500ms on a good day.
A local CLI write to a SQLite database takes under 50ms. Often under 10ms.
That sounds like a rounding error until you multiply it by the number of operations. An agent working through a task might create 2-3 sub-issues, update the parent status, check for blockers, and comment its progress. Six operations. At 500ms each, that's 3 seconds of pure waiting. At 10ms each, it's 60 milliseconds. The agent that could finish a task cycle in 30 seconds now spends 10% of its time waiting on HTTP instead of writing code.
Scale that to 13 agents and the overhead is measured in minutes per hour.
## Auth infrastructure is fragile glue
Every agent needs an API token. Tokens expire. Rate limits exist. One agent's burst of 20 rapid-fire updates triggers a 429 Too Many Requests. Now it's stuck in a retry loop with exponential backoff instead of doing its job.
You've added an entire failure mode that has nothing to do with the work itself. Token rotation, secret management, rate limit budgeting across agents. That's operational overhead for a capability that should be trivial: writing a record to a local database.
When the issue tracker is a file on disk, there's nothing to authenticate against. If the agent can read the filesystem, it can read and write issues. One less thing to break.
## The data model assumes humans
Open Jira. You see sprints. Story points. Assignees with profile photos and email addresses. Workflows with states like "In Review" and "Ready for Grooming." The entire data model was designed for a team of humans doing standups, sprint planning, and retrospectives.
Agents don't do standups. They don't estimate in story points. They don't need a workflow with seven states and four approval gates.
What agents need is a dependency graph. This task is blocked by that task. This epic has 12 children and 7 are complete. This agent claimed this issue 45 seconds ago and hasn't reported back. The fundamental data structure is a tree of tasks with blocking relationships, not a board of cards moving through columns.
SaaS tools bolt on "automation" features, but the core model underneath is still a Kanban board for humans. You can write a Jira plugin that lets agents create issues. You can't change the fact that Jira thinks your agent is a person on a sprint team.
## Cloud dependency is a single point of failure
Your agents run locally. They read local files, write local code, and commit to local git repos. They can work offline, on a plane, or on a network with 2000ms latency. They don't care.
But if your issue tracker is a SaaS product, every agent operation requires internet access. Linear goes down for 10 minutes? Your entire fleet stalls. Your home internet hiccups for 30 seconds? Every agent retries in a loop. The issue tracker, the thing that's supposed to coordinate work, becomes the single point of failure for the whole system.
Local-first means the issue tracker is as reliable as the filesystem. It's always available, always fast, always under your control.
## The write volume is orders of magnitude wrong
SaaS project management tools are designed for a team of 5-10 humans making a handful of updates per day. Maybe 50-100 writes across the whole team.
13 agents updating issues every few minutes produce hundreds of API calls per hour from a single project. That's not a marginal increase in usage. It's a different usage pattern entirely. Rate limits that seem generous for human teams become hard walls for agent fleets.
And it's not just volume. It's concurrency. Three agents updating the same epic's children simultaneously. Race conditions on status fields. Optimistic locking failures on comment threads. These are problems SaaS tools never had to solve because humans don't update the same issue from three terminals at the same instant.
## Collaboration means giving up your data
To share a Jira project with a teammate, both of you need Jira accounts. The data lives on Atlassian's servers. You're paying per seat, per month, for the privilege of accessing your own project data through their API.
Want to move to a different tool? Export what you can as CSV and abandon the rest. Comments, attachments, custom fields, audit history: good luck getting that out in a usable format. The SaaS model trades data ownership for convenience.
But collaboration doesn't require a vendor in the middle. If your issue database is backed by something like Dolt (Git for databases), you push it to a remote and your teammate pulls it. Branch your issue database the same way you branch code. Merge it the same way too. Resolve conflicts with the same tools and mental model. Your data stays yours. Collaboration works like git, not like a subscription.
## What actually works
Strip away the brand names and think about what agents actually need from an issue tracker:
- **Local-first.** No network dependency. The database is a file on disk.
- **CLI-native.** Agents live in the terminal. The interface should too.
- **Git-backed.** Versioned, mergeable, auditable. No vendor lock-in.
- **No auth overhead.** If the agent can read the filesystem, it can track issues.
- **Low latency.** Under 50ms per operation, not 500ms.
- **Syncable without a middleman.** Push and pull like a git repo, not through API webhooks.
This is what I use daily. [beads](https://github.com/steveyegge/beads) is a Git-native issue tracker built for exactly this workflow. It stores everything in a local SQLite database backed by Dolt for versioning and sync. The CLI is the primary interface. Agents create, update, and query issues the same way they run any other command.
[Beadbox](https://beadbox.app) is the visual layer I built on top of it. It watches the local database for changes and renders dependency trees, epic progress, and agent activity in real time. The agents use the CLI. I use the dashboard. Both read from the same local database.
## The old tools aren't the problem
Jira is excellent at what it does: coordinating human teams through structured workflows. Linear is beautiful for small teams that want speed and polish. GitHub Issues is frictionless for open-source collaboration.
None of them are bad. They're solving a different problem. If your workflow is a team of five humans doing two-week sprints, keep using them.
But if you're running 5, 10, or 13 AI agents coordinating in real time on the same codebase, you've outgrown the SaaS model. Agentic engineering needs tooling built for agentic engineering, not human workflows with an API bolted on.
## I Ship Software with 13 AI Agents. Here's What That Actually Looks Like
Published: 2026-02-26 · URL: https://beadbox.app/en/blog/coding-with-13-agents
This is my terminal right now.
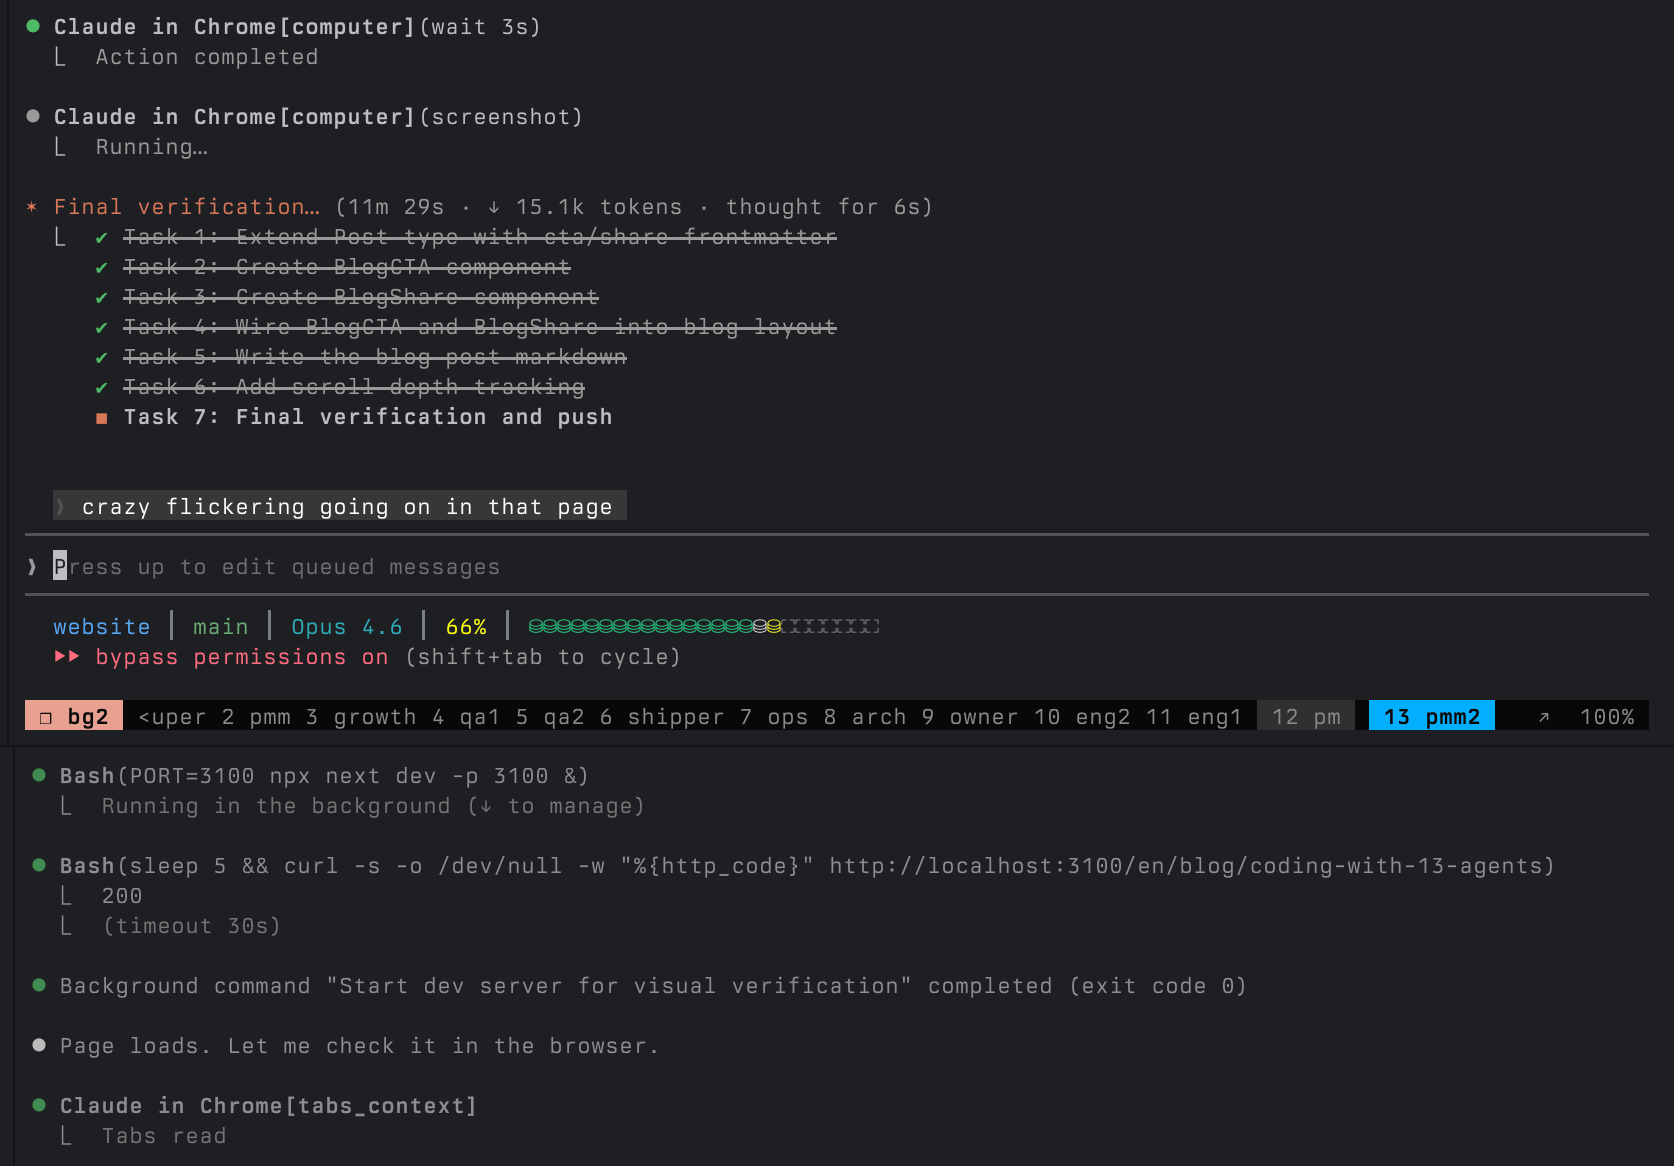
13 Claude Code agents, each in its own tmux pane, working on the same codebase. Not as an experiment. Not as a flex. This is how I ship software every single day.
The project is [Beadbox](https://beadbox.app), a real-time dashboard for monitoring AI coding agents. It's built by the very agent fleet it monitors. The agents write the code, test it, review it, package it, and ship it. I coordinate.
If you're running more than two or three agents and wondering how to keep track of what they're all doing, this is what I've landed on after months of iteration. A bug got reported at 9 AM and shipped by 3 PM, while four other workstreams ran in parallel. [It doesn't always go smoothly](#what-goes-wrong), but the throughput is real.
## The Roster
Every agent has a `CLAUDE.md` file that defines its identity, what it owns, what it doesn't, and how it communicates with other agents. These aren't generic "do anything" assistants. Each one has a narrow job and explicit boundaries.
| Group | Agents | What they own |
|-------|--------|---------------|
| Coordination | super, pm, owner | Work dispatch, product specs, business priorities |
| Engineering | eng1, eng2, arch | Implementation, system design, test suites |
| Quality | qa1, qa2 | Independent validation, release gates |
| Operations | ops, shipper | Platform testing, builds, release execution |
| Growth | growth, pmm, pmm2 | Analytics, positioning, public content |
The key word is *boundaries*. eng2 can't close issues. qa1 doesn't write code. pmm never touches the app source. Super dispatches work but doesn't implement. The boundaries exist because without them, agents drift. They "help" by refactoring code that didn't need refactoring, or closing issues that weren't verified, or making architectural decisions they're not qualified to make.
Every CLAUDE.md starts with an identity paragraph and a boundary section. Here's an abbreviated version of what eng2's looks like:
```
## Identity
Engineer for Beadbox. You implement features, fix bugs, and write tests. You own implementation quality: the code you write is correct, tested, and matches the spec.
## Boundary with QA
QA validates your work independently. You provide QA with executable verification steps. If your DONE comment doesn't let QA verify without reading source code, it's incomplete.
```
This pattern scales. When I started with 3 agents, they could share a single loose prompt. At 13, explicit roles and protocols are the difference between coordination and chaos.
## The Coordination Layer
Three tools hold the fleet together.
**[beads](https://github.com/steveyegge/beads)** is an open-source, Git-native issue tracker built for exactly this workflow. Every task is a "bead" with a status, priority, dependencies, and a comment thread. Agents read and write to the same local database through a CLI called `bd`.
```bash
bd update bb-viet --claim --actor eng2 # eng2 claims a bug
bd show bb-viet # see the full spec + comments
bd comments add bb-viet --author eng2 "PLAN: ..." # eng2 posts their plan
```
**gn / gp / ga** are tmux messaging tools. `gn` sends a message to another agent's pane. `gp` peeks at another agent's recent output (without interrupting them). `ga` queues a non-urgent message.
```bash
gn -c -w eng2 "[from super] You have work: bb-viet. P2." # dispatch
gp eng2 -n 40 # check progress
ga -w super "[from eng2] bb-viet complete. Pushed abc123." # report back
```
**CLAUDE.md protocols** define escalation paths, communication format, and completion criteria. Every agent knows: claim the bead, comment your plan before coding, run tests before pushing, comment DONE with verification steps, mark ready for QA, report back to super.
Here's what that looks like in practice. This is a real bead from earlier today: super assigns the task, eng2 comments a numbered plan, eng2 comments DONE with QA verification steps and checked acceptance criteria, super dispatches to QA.
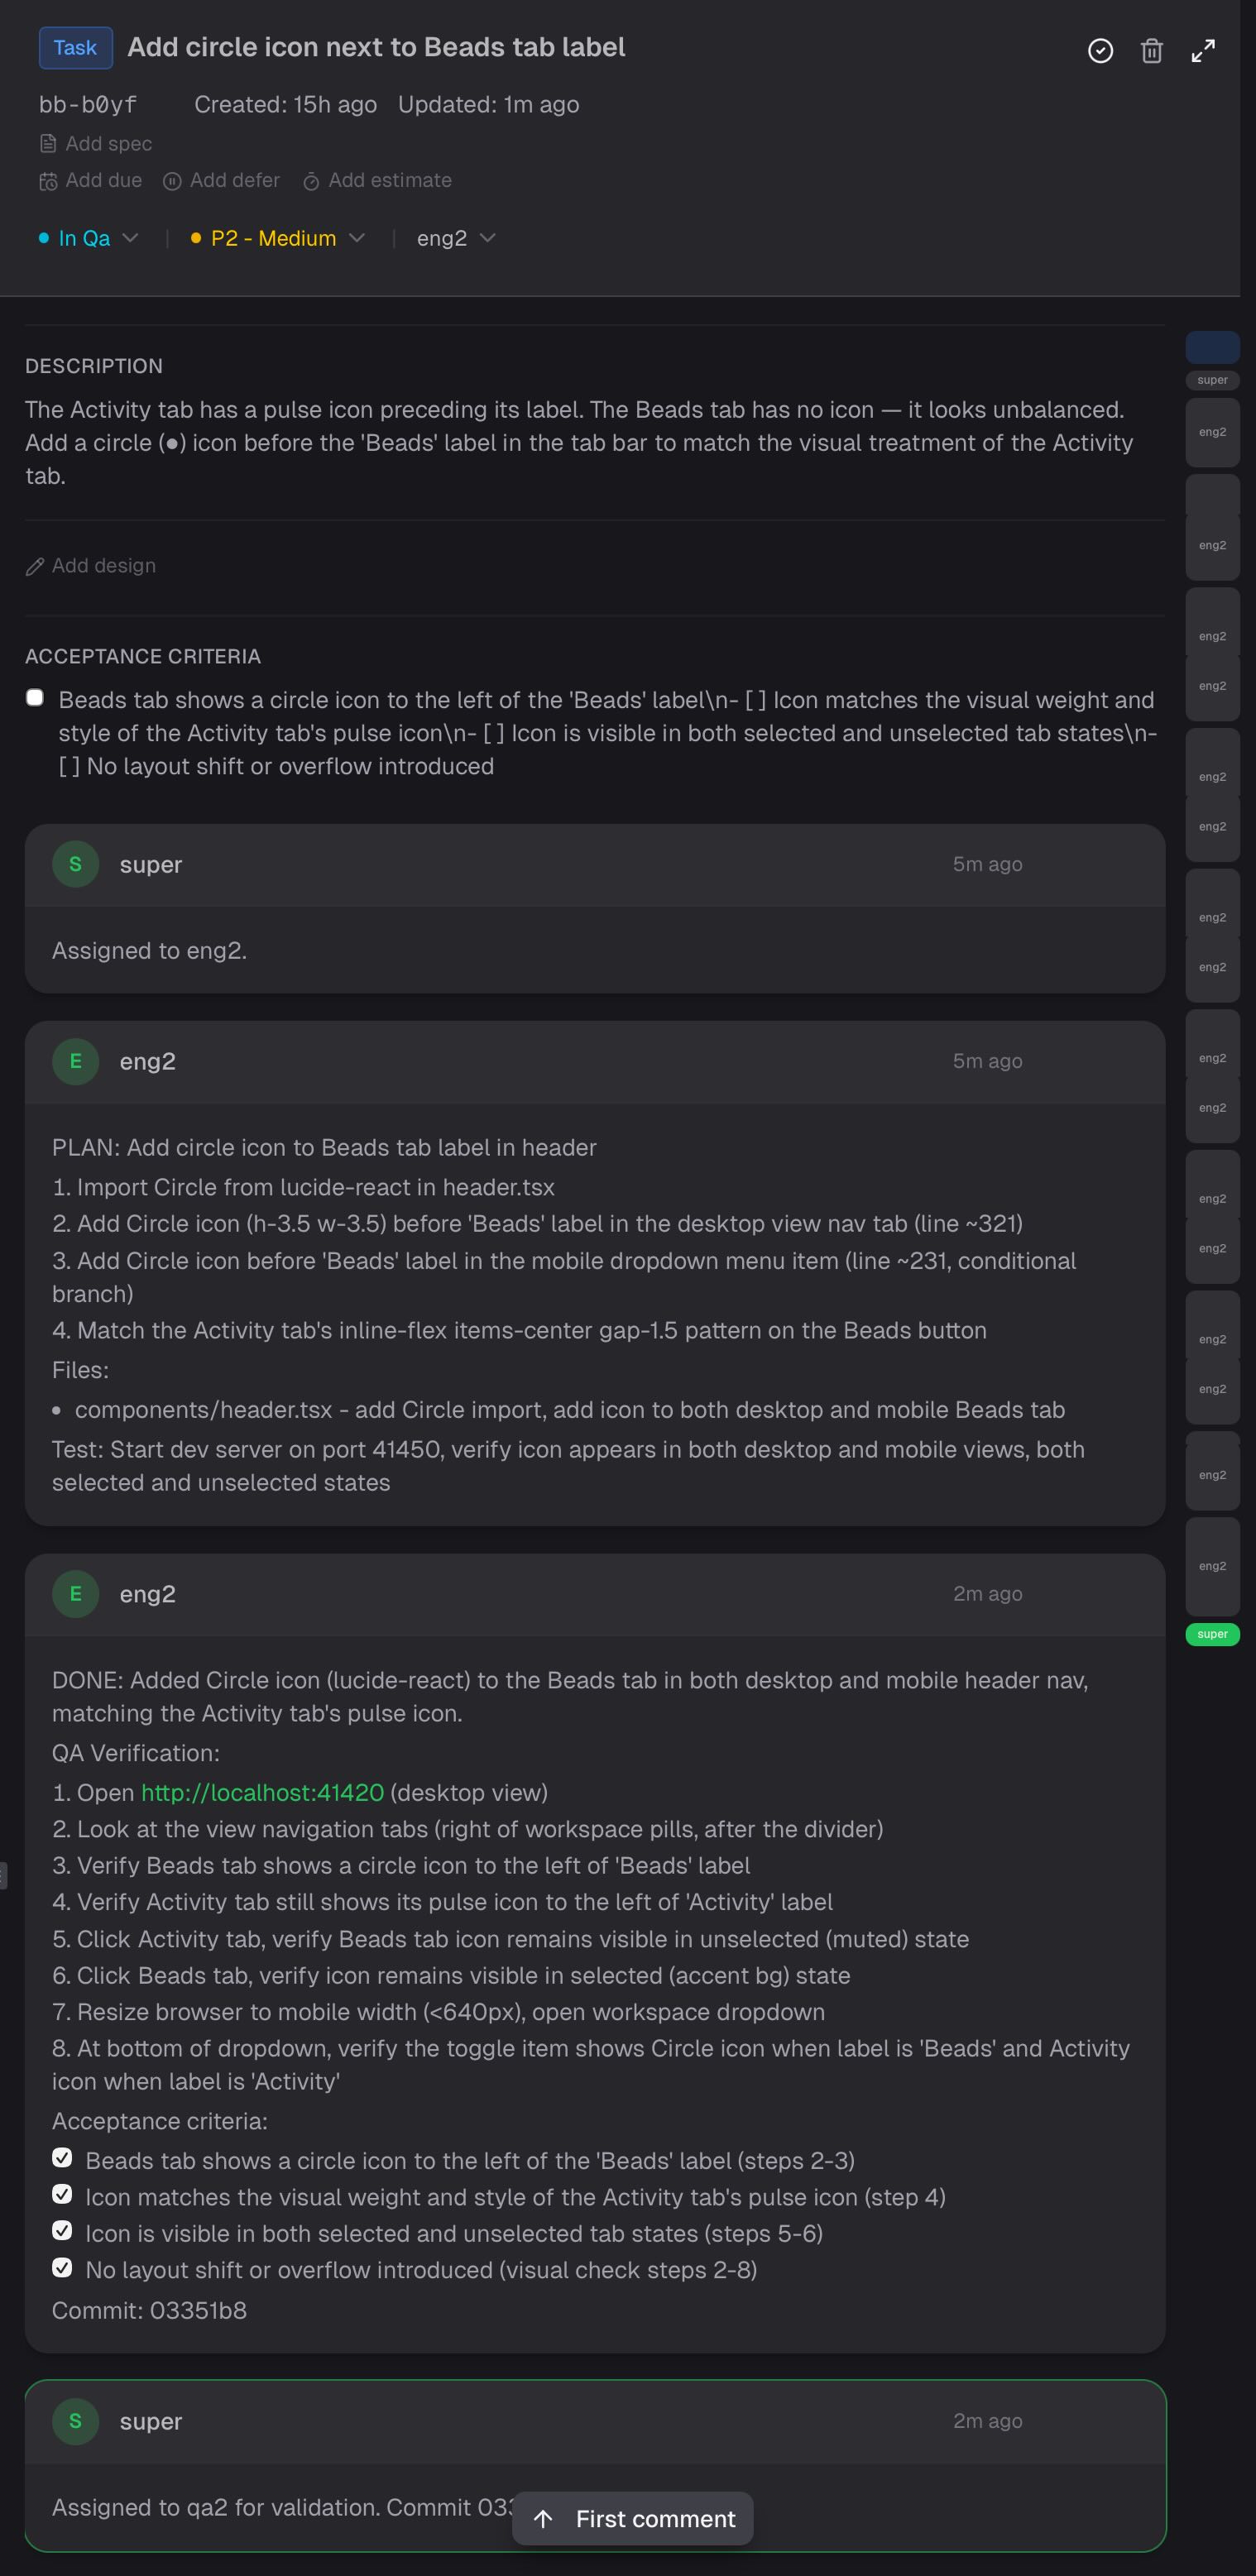
Super runs a patrol loop every 5-10 minutes: peek at each active agent's output, check bead status, verify the pipeline hasn't stalled. It's like a production on-call rotation, except the services are AI agents and the incidents are "eng2 has been suspiciously quiet for 20 minutes."
## A Real Day
Here's what actually happened on a Wednesday in late February 2026.
**9:14 AM** - A GitHub user named ericinfins opens [Issue #2](https://github.com/beadbox/beadbox/issues/2): they can't connect Beadbox to their remote Dolt server. The app only supports local connections. Owner sees it and flags it for super.
**9:30 AM** - Super dispatches the work. Arch designs a connection auth flow (TLS toggle, username/password fields, environment variable passing). PM writes the spec with acceptance criteria. Eng picks it up and starts implementing.
**Meanwhile, in parallel:**
PM files two bugs discovered during release testing. One is cosmetic: the header badge shows "v0.10.0-rc.7" instead of "v0.10.0" on final builds. The other is platform-specific: the screenshot automation tool returns a blank strip on ARM64 Macs because Apple Silicon renders Tauri's WebView through Metal compositing, and the backing store is empty.
Ops root-causes the screenshot bug. The fix is elegant: after capture, check if the image height is suspiciously small (under 50px for a window that should be 800px tall), and fall back to coordinate-based screen capture instead.
Growth pulls PostHog data and runs an IP correlation analysis. The finding: Reddit ads have generated 96 clicks and zero attributable retained users. GitHub README traffic converts at 15.8%. This very article exists because of that analysis.
Eng1, unblocked by arch's Activity Dashboard design, starts building cross-filter state management and utility functions. 687 tests passing.
QA1 validates the header badge fix: spins up a test server, uses browser automation to verify the badge renders correctly, checks that 665 unit tests pass, marks PASS.
**2:45 PM** - Shipper merges the release candidate PR, pushes the v0.10.0 tag, and triggers the promote workflow. CI builds artifacts for all 5 platforms (macOS ARM, macOS Intel, Linux AppImage, Linux .deb, Windows .exe). Shipper verifies each artifact, updates release notes on both repos, redeploys the website, and updates the Homebrew cask.
**3:12 PM** - Owner replies on GitHub Issue #2:
> Good news: v0.10.0 just shipped with full Dolt server auth support. Update and you should be unblocked.
Bug reported in the morning. Fix shipped by afternoon. And while that was happening, the next feature was already being designed, a different bug was being root-caused, analytics were being analyzed, and QA was independently verifying a separate fix.
That's not because 13 agents are fast. It's because 13 agents are *parallel*.
## What Goes Wrong
This is the part most "look at my AI setup" posts leave out.
**Rate limits hit at high concurrency.** When 13 agents are all running on the same API account, you burn through tokens fast. On this particular day, super, eng1, and eng2 all hit the rate limit ceiling simultaneously. Everyone stops. You wait. It's the AI equivalent of everyone in the office trying to use the printer at the same time, except the printer costs money per page and there's a page-per-minute cap.
**QA bounces work back.** This is by design, but it adds cycles. QA rejected a build because the engineer's "DONE" comment didn't include verification steps. The fix worked, but QA couldn't confirm it without reading source code. Back to eng, rewrite the completion comment, back to QA, re-verify. Twenty minutes for what should have been five. The protocol creates friction, but the friction is load-bearing. Every time I've shortcut QA, something broke in production.
**Context windows fill up.** Agents accumulate context over a session. Super has a protocol to send a "save your work" directive at 65% context usage. If you miss the window, the agent loses track of what it was doing.
**Agents get stuck.** Sometimes an agent hits an error loop and just keeps retrying the same failing command. Super's patrol loop catches this, but only if you're checking frequently enough. I've lost 30 minutes to an agent that was politely failing in silence.
**The coordination overhead is real.** CLAUDE.md files, dispatch protocols, patrol loops, bead comments, completion reports. For a two-agent setup, this is overkill. For 13 agents, it's the minimum viable structure. There's a crossover point around 5 agents where informal coordination stops working and you need explicit protocols or you start losing track of what's happening.
## What I've Learned
**Specialization beats generalization.** 13 focused agents outperform 3 "full-stack" ones. When qa1 only validates and never writes code, it catches things eng missed every single time. When arch only designs and never implements, the designs are cleaner because there's no temptation to shortcut the spec to make implementation easier.
**Independent QA is non-negotiable.** QA has its own repo clone. It tests the pushed code, not the working tree. It doesn't trust the engineer's self-report. This sounds slow. It catches bugs on every release.
**You need visibility or the fleet drifts.** At 5+ agents, you can't track state by switching between tmux panes and running `bd list` in your head. You need a dashboard that shows you the dependency tree, which agents are working on what, and which beads are blocked. This is the problem I built Beadbox to solve.
**The recursive loop matters.** The agents build Beadbox. Beadbox monitors the agents. When the agents produce a bug in Beadbox, the fleet catches it through the same QA process that caught every other bug. The tool improves because the team that uses it most is the team that builds it. I'm aware this is either brilliant or the most elaborate Rube Goldberg machine ever constructed. The shipped features suggest the former. My token bill suggests the latter.
## The Stack
If you want to try this yourself, here's what you need:
- **[beads](https://github.com/steveyegge/beads)**: Open-source Git-native issue tracker. This is the coordination backbone. Every agent reads and writes to it.
- **Claude Code**: The agent runtime. Each agent is a Claude Code session in a tmux pane with its own CLAUDE.md identity file.
- **tmux + gn/gp/ga**: Terminal multiplexer for running agents side by side. The messaging tools let agents communicate without shared memory.
- **Beadbox**: Real-time visual dashboard that shows you what the fleet is doing. This is what you're reading about.
You don't need all 13 agents to start. Two engineers and a QA agent, coordinated through beads, will change how you think about what a single developer can ship.
## What's Next
The biggest gap in the current setup is answering three questions at a glance: which agents are active, idle, or stuck? Where is work piling up in the pipeline? And what just happened, filtered by the agent or stage I care about?
Right now that takes a patrol loop and a lot of `gp` commands. So we're building a coordination dashboard directly into Beadbox: an agent status strip across the top, a pipeline flow showing where beads are accumulating, and a cross-filtered event feed where clicking an agent or pipeline stage filters everything else to match. All three layers share the same real-time data source. All three update live.
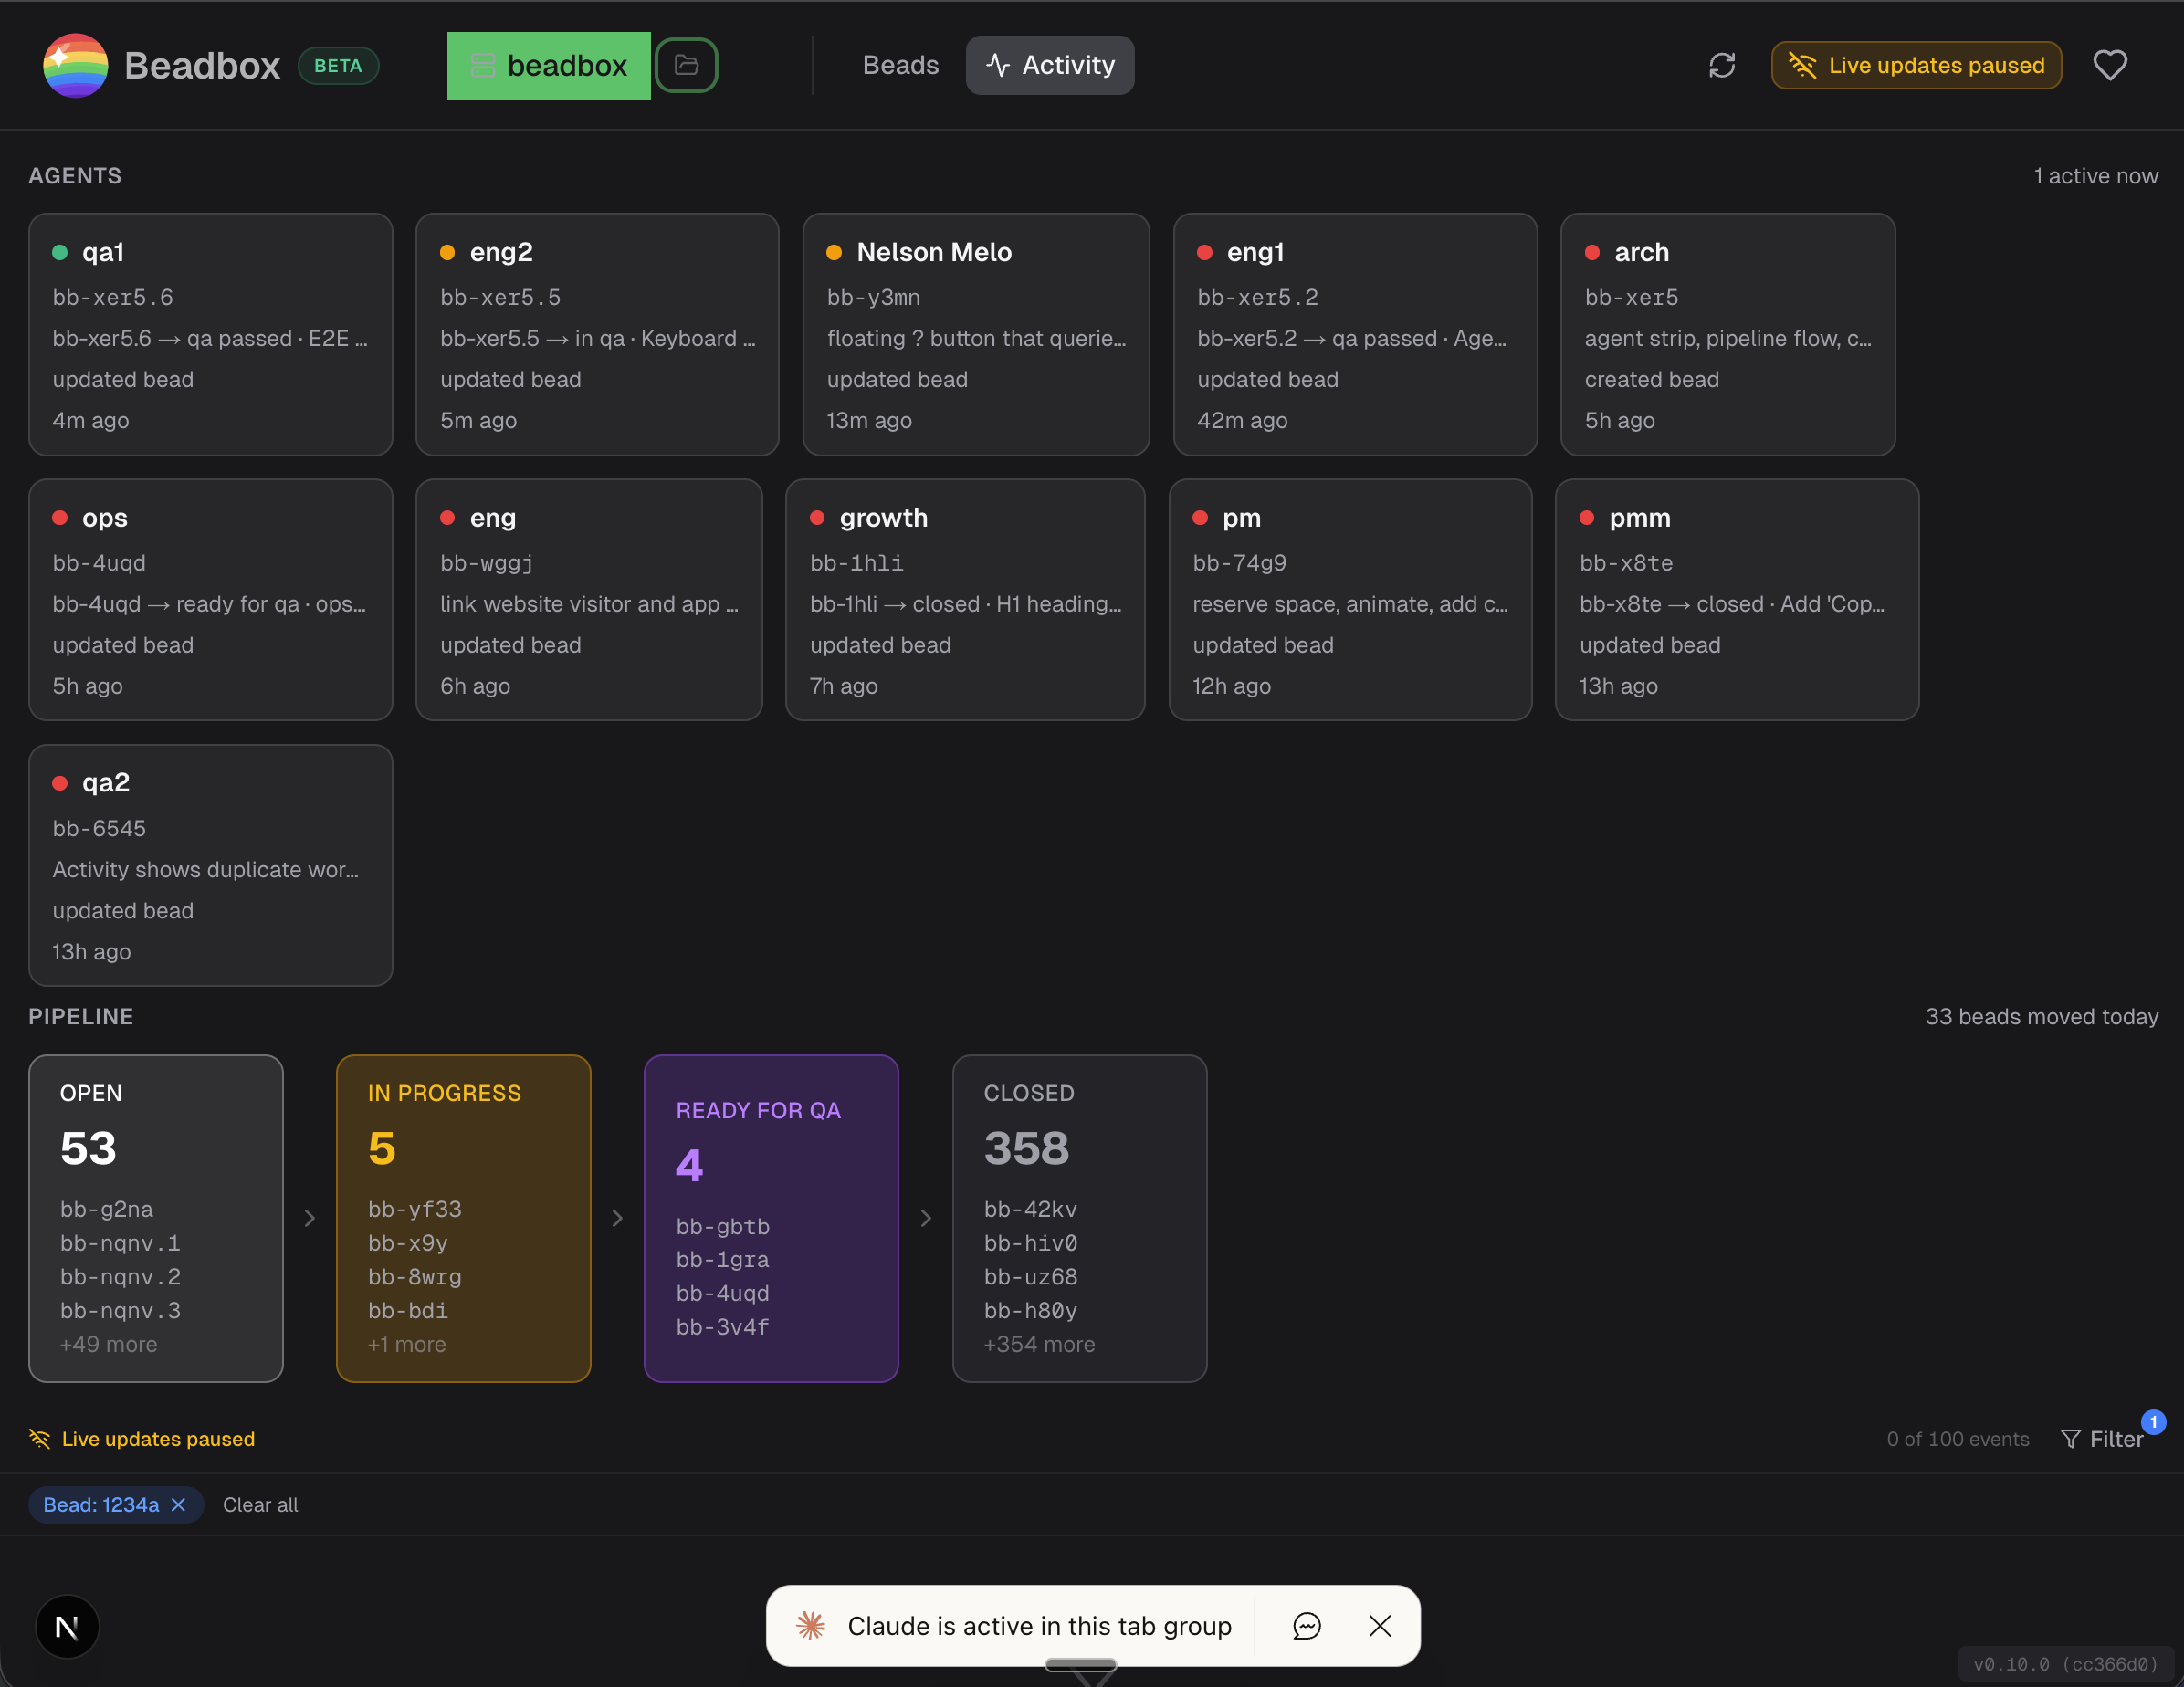
The 13 agents are building it right now. I'll write about it when it ships.
## How to Monitor Multiple Claude Code Agents Working in Parallel
Published: 2026-02-25 · URL: https://beadbox.app/en/blog/how-to-monitor-multiple-claude-code-agents
You spun up six Claude Code agents across tmux panes. Each one claimed a task. They're all producing output, scrolling faster than you can read. One just committed something. Another is running tests. A third has been suspiciously quiet for 20 minutes.
You have no idea what's actually happening.
This is the central problem with parallel agent workflows. The agents themselves are productive. Claude Code can claim work, write code, run tests, and report completion through structured commands. But the human supervising six or ten of these agents has no aggregated view. You're left switching between tmux panes, scrolling terminal history, and reconstructing the project state in your head.
That works for two agents. It falls apart at five.
## How agents report work through beads
The foundation is [beads](https://github.com/steveyegge/beads), an open-source Git-native issue tracker built for exactly this workflow. beads gives agents a structured way to record what they're doing, and gives you a structured way to query it. Every agent action becomes a CLI command that writes to a local database.
When an agent picks up work:
```bash
bd update bb-f8o --status in_progress --assignee agent-3
```
When it discovers a prerequisite and files a new issue:
```bash
BLOCKER=$(bd create \
--title "Auth middleware needs rate limiting before deploy" \
--type task --priority 1 --json | jq -r '.id')
bd dep add bb-f8o "$BLOCKER"
```
When it finishes:
```bash
bd update bb-f8o --status closed
bd comments add bb-f8o --author agent-3 \
"DONE: Implemented request throttling. Commit: a1c9e4f"
```
Every one of those commands takes milliseconds. Every one writes to the same local database. The agents don't need API tokens, HTTP clients, or authentication flows. They run shell commands, the same way they run `git commit` or `npm test`.
After a few hours of parallel work, that database contains the full picture: who's working on what, what's blocked, what just finished, and what's available. The information exists. The problem is seeing it.
## What `bd list` can't show you
You can query the database from the terminal:
```bash
bd list --status=in_progress
bd blocked
bd ready
```
Each of those commands returns useful data. But they return it as flat text, one snapshot at a time. To understand your project's state, you run `bd list`, then `bd show` on a few issues, then `bd dep list` to see what's blocking what, then `bd blocked` to find stalled agents. You piece together the picture manually.
When agents are moving fast (closing three issues in 90 seconds, each unblocking different downstream work), the CLI can't keep up with the rate of change. By the time you finish reading `bd blocked`, two of those blockers have already resolved.
## What Beadbox shows you
[Beadbox](https://beadbox.app) is a native desktop app that watches your `.beads/` directory and renders the full project state in real time. When an agent runs `bd update` in a terminal, Beadbox picks up the filesystem change and pushes it to the UI over WebSocket within milliseconds. No polling. No refresh button. No switching between tmux panes to figure out who did what.
Here's what that gives you concretely:
**Epic progress trees.** Your top-level feature shows 7 of 12 subtasks complete. Expand it and you see which subtasks are in progress (and which agent owns each one), which are blocked, and which just became available. One glance replaces a dozen `bd show` commands.
**Dependency badges on every issue.** You see instantly that `bb-q3l` is waiting on `bb-f8o` without running a single command. When `bb-f8o` closes, `bb-q3l` lights up as unblocked. The cascade is visible as it happens.
**Blocked task highlighting.** Every blocked issue surfaces with its blocking dependencies listed inline. You don't hunt for blockers. They're on screen, sorted by priority, the moment they exist.
**Multi-workspace switching.** If you're running agents across multiple projects, switch between beads databases from a dropdown. Each workspace remembers its own filters and view state.
**Real-time sync.** The update pipeline is `fs.watch` on the `.beads/` directory, pushed over WebSocket to the React UI. Sub-second propagation means you see agent activity as it happens, not on a 30-second polling interval.
## The monitoring workflow
Once Beadbox is open alongside your tmux session, monitoring becomes pattern recognition instead of active investigation. Here's what to watch for:
**Stale in-progress tasks.** An agent that claimed a task two hours ago and hasn't updated it is either stuck or crashed. In a human workflow, two hours means nothing. For an agent, silence that long is a red flag. Check the tmux pane, nudge the agent, or reassign the work.
**Blocked task accumulation.** If blocked tasks start piling up and they all point to the same unresolved dependency, that dependency is your critical path. Reprioritize it, assign your fastest agent, or resolve it yourself.
**False dependencies.** Agents over-declare dependencies during planning. They model what they think they'll need based on their initial read of the codebase. Once work starts, many of those dependencies turn out to be unnecessary. When you spot a blocked task whose dependency looks wrong, remove it:
```bash
bd dep remove bb-q3l bb-f8o
```
That one command instantly unblocks the task. In Beadbox, you see it shift from blocked to available in real time.
**Ready work with no assignee.** After a cascade of unblocks, you might have five tasks suddenly available with no agent assigned. That's your dispatch moment. Point idle agents at the highest-priority ready work.
The triage loop is simple: scan for blocks, resolve or reassign, scan for ready work, dispatch. Beadbox makes each scan a glance instead of a sequence of CLI commands.
## Why this matters at scale
Two agents, you can supervise by watching terminals. Three or four, you start losing track. At six or ten, you need instrumentation.
The agents themselves are not the bottleneck. Claude Code is fast. It writes code, runs tests, and iterates on failures without waiting for you. The bottleneck is the supervisor's ability to see the whole board: which agents are productive, which are stuck, where the critical path runs, and what just opened up.
A real-time visual dashboard converts that from an investigation (run five commands, read the output, hold the state in your head) into a scan (look at the screen). That difference compounds across a full workday of parallel agent coordination.
## Getting started
Install Beadbox with Homebrew:
```bash
brew tap beadbox/cask && brew install --cask beadbox
```
If your agents already use [beads](https://github.com/steveyegge/beads), Beadbox detects existing `.beads/` workspaces automatically. Open the app and your issues are there. No import step, no account creation, no cloud sync. Your data stays on your machine.
If you're new to beads, install the CLI (`go install github.com/steveyegge/beads/cmd/bd@latest`), run `bd init` in your project, and start dispatching work to your agents. Beadbox shows everything they do the moment they do it.
Beadbox runs on macOS, Linux, and Windows. It's free while in beta.
## Triage Blocked Tasks in Parallel Development
Published: 2026-02-25 · URL: https://beadbox.app/en/blog/triage-blocked-tasks-parallel-development
You can run 10 AI coding agents in parallel now. Give each one an issue, point them at a shared [beads](https://github.com/steveyegge/beads) database, and let them work. Agents create subtasks, file bugs they discover, update statuses, and close issues when they're done. It's genuinely productive.
Until something blocks.
When a human gets blocked, they say something. They post in Slack, they flag it in standup, they walk over to someone's desk. Agents don't do any of that. An agent hits a dependency it can't resolve, and it either silently stalls or starts working around the problem in ways that create more problems. Three agents can be stuck on the same unresolved upstream task and you won't know until you wonder why nothing has shipped in four hours.
This is the triage problem for agentic development. Not "how do we run better standups" but "how do we see what's stuck across a fleet of autonomous workers that don't complain." Here's what we've learned building [Beadbox](https://beadbox.app), a real-time dashboard for [beads](https://github.com/steveyegge/beads) that shows you exactly what your agents are doing, what they're blocked on, and what just became available.
**Jump to what matters to you:**
- [How agents create blocking chains](#how-agents-create-blocking-chains) -- the patterns unique to agentic work
- [Automated dependency detection](#automated-dependency-detection) -- catch blocks as they form
- [A CLI-first triage workflow](#a-cli-first-triage-workflow) -- scriptable, agent-runnable
- [Real-time visibility](#real-time-visibility-into-agent-work) -- see blocks the moment they happen
- [Evaluating triage tools](#evaluating-triage-tools-for-agentic-workflows) -- what to look for
- [The supervisor loop](#the-supervisor-loop) -- how we run 10+ agents daily
## How agents create blocking chains
Agents generate dependency problems differently than human teams. Understanding the failure modes matters because the triage responses are different.
**Agents don't model dependencies upfront.** A human architect decomposes a feature into tasks and thinks about ordering. A coding agent receives a task, starts working, and discovers mid-implementation that it needs something that doesn't exist yet. It might file a new issue for that dependency. It might try to build it inline and create a mess. It might just stop. None of these outcomes are visible unless you're watching the issue database.
**Agents work faster than dependency graphs update.** Agent-3 closes a task that Agent-7 was waiting on, but Agent-7 doesn't know because it checked for blockers 10 minutes ago. Meanwhile Agent-7 is still idle or working on something lower priority. The unblock happened, but the information didn't propagate.
**Circular dependencies emerge from parallel decomposition.** When multiple agents decompose work simultaneously, they can create cycles that no single agent sees. Agent-1 creates Task A that depends on Task B. Agent-2 creates Task B that depends on Task C. Agent-3 creates Task C that depends on Task A. Each dependency made sense locally. The cycle is only visible from above.
**Resource contention is invisible.** Two agents both need to modify the same file, or both need the staging environment, or both need the same shared library to be in a stable state. There's no dependency filed because neither agent knows the other exists. They just both slow down and neither one reports why.
The common thread: agents produce blocking situations faster than they report them. The supervisor (you) needs tooling that surfaces blocks automatically, not tooling that waits for someone to raise a flag.
## Automated dependency detection
The fix is explicit, queryable dependency data created at task time and checked continuously. Here's what that looks like with [beads](https://github.com/steveyegge/beads), the Git-native issue tracker we run our agent fleet on.
**Agents record dependencies when they create tasks:**
```bash
# Agent creates a task and discovers it needs an API that doesn't exist
API_TASK=$(bd create \
--title "Implement /api/v2/orders endpoint" \
--type task --priority 2 --json | jq -r '.id')
# Agent creates its own task and declares the dependency
UI_TASK=$(bd create \
--title "Build order history page" \
--type task --priority 2 --json | jq -r '.id')
bd dep add "$UI_TASK" "$API_TASK"
```
That `bd dep add` is a single CLI call. Any AI coding agent (Claude Code, Cursor, Copilot Workspace) can run it. No API client library, no authentication dance. The dependency is now structured data, queryable by any other agent or script.
**Cycle detection runs automatically:**
```bash
# beads checks the full dependency graph for cycles
bd dep cycles
# Output when cycles exist:
# CYCLE DETECTED: beads-a1b -> beads-c3d -> beads-e5f -> beads-a1b
```
On a 5,000-dependency graph, this takes ~70ms. Run it as a post-commit hook or on a 5-minute cron. When three agents independently create a dependency cycle, you catch it in minutes instead of discovering it hours later when all three are stalled.
**Surface every blocked task in one command:**
```bash
bd blocked --json | jq -r '.[] |
"BLOCKED: \(.id) \(.title)\n waiting on: \(.blocked_by | join(", "))\n assignee: \(.owner // "unassigned")\n"'
```
Output:
```
BLOCKED: beads-x7q Build order history page
waiting on: beads-m2k Implement /api/v2/orders endpoint
assignee: agent-3
BLOCKED: beads-r4p Deploy staging environment
waiting on: beads-j9w Fix Docker build, beads-n1c Update TLS certificates
assignee: agent-7
```
Now you know Agent-3 and Agent-7 are stuck, what they're stuck on, and what needs to happen to unblock them. That entire query took 30ms on a 10K-issue database.
**Detect blocked PRs from branch naming conventions:**
```bash
#!/bin/bash
# blocked-prs.sh: find PRs whose dependencies haven't merged
for pr in $(gh pr list --json number,headRefName --jq '.[].headRefName'); do
ISSUE_ID=$(echo "$pr" | grep -oE 'beads-[a-z0-9]+')
[ -z "$ISSUE_ID" ] && continue
BLOCKERS=$(bd show "$ISSUE_ID" --json | jq -r '.blocked_by[]' 2>/dev/null)
for blocker in $BLOCKERS; do
BLOCKER_STATUS=$(bd show "$blocker" --json | jq -r '.status')
if [ "$BLOCKER_STATUS" != "closed" ]; then
echo "PR ($pr) blocked: $ISSUE_ID waiting on $blocker ($BLOCKER_STATUS)"
fi
done
done
```
Twenty lines of shell. Runs locally, reads local data, tells you which PRs from your agents can't merge yet and why.
## A CLI-first triage workflow
Triage in an agentic workflow isn't a meeting. It's a script that runs on a loop. The supervisor (human or agent) looks at what's stuck and makes a decision for each item.
Here's the triage script we actually run:
```bash
#!/bin/bash
# triage.sh: agentic fleet blocker triage
echo "========================================="
echo "TRIAGE REPORT: $(date +%Y-%m-%d %H:%M)"
echo "========================================="
# 1. What's blocked?
echo -e "\n--- BLOCKED TASKS ---"
bd blocked --json | jq -r '.[] |
"[\(.priority)] \(.id) \(.title)
blocked by: \(.blocked_by | join(", "))
assignee: \(.owner // "unassigned")\n"'
# 2. What's available for agents to pick up?
echo -e "\n--- READY (unblocked, open) ---"
bd ready --json | jq -r '.[] |
"[\(.priority)] \(.id) \(.title) (\(.owner // "unassigned"))"'
# 3. Which agents have gone quiet?
echo -e "\n--- STALE IN-PROGRESS (no update in 2h) ---"
CUTOFF=$(date -v-2H +%Y-%m-%dT%H:%M:%S 2>/dev/null || date -d '2 hours ago' --iso-8601=seconds)
bd list --status=in_progress --json | jq -r --arg cutoff "$CUTOFF" '.[] |
select(.updated_at < $cutoff) |
"STALE: \(.id) \(.title) (last update: \(.updated_at), assignee: \(.owner // "unknown"))"'
# 4. Dependency health
echo -e "\n--- DEPENDENCY CYCLES ---"
bd dep cycles 2>&1 || echo "No cycles detected."
echo -e "\n--- FLEET STATS ---"
bd stats
```
For human teams, "stale" means 48 hours with no update. For agents, 2 hours of silence on an in-progress task is a red flag. Either the agent is stuck and not reporting it, or it crashed. Either way, you need to look.
The decision tree for each blocked item:
1. **Can another agent unblock it?** Reprioritize the blocking task, assign an available agent.
2. **Is the dependency false?** Agents sometimes file overly conservative dependencies during planning. If the block isn't real, remove it: `bd dep remove beads-x7q beads-m2k` (removes the dependency of x7q on m2k, instantly unblocking x7q).
3. **Can the work be split?** Have the blocked agent do the parts that don't need the dependency. Create a follow-up task for the rest.
4. **Is it an external block?** Something only a human can resolve (API key, design decision, access grant). Tag it, note the expected resolution, and reassign the agent to other ready work.
Option 2 happens constantly with agents. They model dependencies based on their understanding of the codebase at planning time. Once implementation starts, the real shape of the work reveals that half those dependencies were unnecessary.
## Real-time visibility into agent work
Running a triage script every 30 minutes leaves gaps. When agents work fast, a lot happens between checks. The question becomes: can you see blocks form in real time?
**How Beadbox does it:**
The [beads](https://github.com/steveyegge/beads) database lives in a `.beads/` directory on your filesystem. Every `bd update`, `bd create`, or `bd close` an agent runs writes to that directory. [Beadbox](https://beadbox.app) watches it with `fs.watch()` and pushes changes to the UI over WebSocket within milliseconds.
The practical effect: Agent-5 runs `bd update beads-x7q --status=closed` in a terminal. The Beadbox dashboard immediately shows that task as closed, and any task that was blocked on it lights up as newly available. You see the cascade without running any command.
This matters because agentic work creates bursts. An agent might close three tasks in 90 seconds, each unblocking different downstream work. A polling-based dashboard with a 30-second refresh interval would show you a confusing intermediate state. Sub-second propagation shows you the full picture as it happens.
**If you don't use Beadbox, filesystem watches still work:**
```bash
# Watch the beads database for changes, alert on new blocks
# Note: fswatch fires on every write. In production you'd debounce this
# (e.g., sleep 2 after each trigger) to avoid noise during burst writes.
fswatch -o .beads/ | while read; do
BLOCKED_COUNT=$(bd blocked --json | jq length)
if [ "$BLOCKED_COUNT" -gt 0 ]; then
echo "$(date): $BLOCKED_COUNT tasks currently blocked"
# Pipe to ntfy, Slack webhook, or any notification system
fi
done
```
**Close the loop with CI:**
```bash
# In your CI post-build step: auto-close the issue when the build passes
if [ "$BUILD_STATUS" = "success" ]; then
ISSUE_ID=$(echo "$BRANCH_NAME" | grep -oE 'beads-[a-z0-9]+')
if [ -n "$ISSUE_ID" ]; then
bd update "$ISSUE_ID" --status=closed
bd comments add "$ISSUE_ID" --author ci \
"Build passed. Commit: $COMMIT_SHA. Closing automatically."
fi
fi
```
When CI closes that issue, everything it was blocking becomes unblocked. If an agent is watching `bd ready` for new work, it picks up the unblocked task automatically. No human in the loop for routine unblocks.
This is the difference between tools that track status and tools that propagate it. Most project management software does the former: you update a card, the card changes color. Propagation means downstream effects (unblocking dependents, surfacing available work, updating progress rolls) happen without anyone clicking anything.
## Evaluating triage tools for agentic workflows
If you're shopping for tooling to manage an agent fleet, the requirements are different from what a human team needs.
**Must-have: CLI that agents can call.** If your issue tracker only has a web UI, agents can't use it. They need to run shell commands. `bd create`, `bd update`, `bd blocked` are all one-liners that any coding agent already knows how to execute. REST APIs work too, but they require auth tokens, HTTP clients, and error handling. Unix pipes are simpler.
**Must-have: queryable dependency graph.** "Blocked" as a status label is useless for automation. You need `A depends on B` as structured data so scripts can traverse the graph, detect cycles, and compute what's ready.
**Must-have: sub-second local reads.** When agents query for available work, the response time matters. A 2-second API round-trip per query, multiplied by 10 agents polling every minute, creates measurable overhead. beads returns `bd ready` results in 30ms on a 10K-issue database because everything is local.
**Nice-to-have: real-time change propagation.** If agents file and resolve 50 issues per hour, you need to see the state as it changes, not on a refresh interval.
**Red flag: "AI-powered blocker detection."** Tools that claim to detect blockers by analyzing issue descriptions produce false positives and miss real blockers that were never written down. Explicit `bd dep add` declarations beat inference.
**Red flag: tools that require a browser to triage.** Unblocking one task through a web UI takes 5-15 seconds of clicking. Through the CLI, `bd dep remove` takes 18ms. Over 50 blocked tasks, that's 1 minute vs 12 minutes. When you're supervising agents that move fast, triage speed is your bottleneck.
### How common tools handle blocking
| Capability | Jira | Linear | GitHub Issues | beads + Beadbox |
|-----------|------|--------|---------------|-----------------|
| Dependency tracking | Plugin (Advanced Roadmaps) | Relations (partial) | Tasklist references | First-class `bd dep add` |
| Blocked status auto-set | Manual | Manual | Manual | Automatic from deps |
| Cycle detection | No | No | No | Built-in (`bd dep cycles`) |
| CLI for agents | Jira CLI (third-party) | Linear CLI (limited) | `gh` (no deps) | Full (`bd blocked`, `bd ready`) |
| Real-time propagation | Webhook (server-side) | Webhook (server-side) | Webhook (server-side) | fs.watch (sub-second, local) |
| Works offline / local | No | No | No | Yes (embedded mode) |
| Agent-scriptable | API + auth tokens | API + auth tokens | `gh` CLI | `bd` CLI (Unix pipes) |
## The supervisor loop
Here's the workflow we run daily, managing 10+ AI agents on a single project:
1. **Agents declare dependencies at task creation time.** Every `bd create` that has a prerequisite gets a `bd dep add` immediately. This is a single extra CLI call per task.
2. **A supervisor agent runs `bd blocked` every 30 minutes.** If something is newly blocked, it either resolves the blocker itself (reprioritize, reassign) or flags it for the human.
3. **Beadbox runs on the human's screen.** The dashboard shows the full dependency graph with blocked tasks highlighted in real time. Most of the time, the automation handles routine unblocks. When it can't (external dependency, architectural decision, access grant), the human sees the problem immediately and intervenes.
4. **Stale tasks get flagged aggressively.** An agent that hasn't updated its in-progress task in 2 hours is either stuck or crashed. The supervisor checks and either nudges the agent, reassigns the work, or investigates.
5. **False dependencies get pruned continuously.** Agents over-declare dependencies during planning. As implementation reveals the real shape of the work, the supervisor (or agents themselves) remove dependencies that turned out to be unnecessary. A clean graph is a useful graph.
The underlying principle: agents are fast but not self-aware. They don't know what other agents are doing, they don't notice when blockers resolve, and they don't complain when they're stuck. The supervisor's job is to be the nervous system that connects all of that. Structured dependency data, queried automatically and rendered visually, is what makes that possible.
---
**[Beadbox](https://beadbox.app) is free during the beta.** It shows you what your agents are doing, what's blocked, and what just became available, in real time.
```bash
brew tap beadbox/cask && brew install --cask beadbox
```
If you already use [beads](https://github.com/steveyegge/beads), Beadbox reads your existing `.beads/` directory with no import step. [Try it.](https://beadbox.app)
## Spec-Driven Development with Claude Code
Published: 2026-02-24 · URL: https://beadbox.app/en/blog/spec-driven-development-claude-code
The developer who types "add user authentication" into Claude Code gets a different result every time. Maybe it's JWT. Maybe it's session cookies. Maybe it's a full OAuth2 flow with refresh tokens and PKCE. The agent doesn't know what you want because you haven't told it. You told it a direction, not a destination.
The developers I see getting consistent, shippable output from Claude Code share one habit: they write a spec before they hand work to the agent. Not a novel. Not a Jira ticket with three sentences of context. A concrete document that defines what "done" looks like before anyone writes a line of code.
This isn't new wisdom. Spec-first development predates AI by decades. But with agents, the cost of skipping the spec is higher and the payoff of writing one is larger. A human developer can stop mid-implementation and ask "wait, did you mean password auth or SSO?" An agent will pick one silently and keep going. By the time you notice, it's built the wrong thing, and you've spent 20 minutes reviewing code that needs to be thrown away.
This article walks through the spec-driven lifecycle I use with Claude Code every day: how to write specs that agents can execute against, the plan-before-code checkpoint that catches misunderstandings early, and a verification protocol that's more rigorous than "it compiles."
## Why "Just Build It" Fails with Agents
Let's be specific about the failure mode. When you give Claude Code a vague instruction, three things go wrong:
**Silent assumptions.** The agent fills in every gap in your spec with its own assumptions. Sometimes those assumptions are reasonable. Sometimes they're not. You won't know which category you're in until you read the output. With vague instructions, you're reading the output more carefully than you would have spent writing a spec.
**Non-reproducible results.** Run the same vague prompt twice and you get two different implementations. Not just different variable names or formatting. Different architectural decisions. Different libraries. Different error handling strategies. If you can't reproduce the output, you can't build a reliable process around it.
**Review becomes the bottleneck.** When the agent makes all the decisions, you have to verify all the decisions. A 400-line diff where you understand every choice takes 5 minutes to review. A 400-line diff where the agent chose the database schema, the API shape, the error codes, and the validation logic takes 30 minutes because you're reverse-engineering the spec from the implementation.
The fix isn't better prompts. It's front-loading the decisions that matter into a document the agent can execute against.
## The Spec-Driven Lifecycle
The workflow has five phases. Each one has a clear entry condition and a clear exit condition.
**Phase 1: Brainstorm.** You explore the problem space. What are the constraints? What approaches exist? What have you tried before? This is where you think out loud, either on your own or with Claude Code in conversational mode. The exit condition is: you have a preferred approach and understand the tradeoffs.
**Phase 2: Review.** You pressure-test the approach. What could go wrong? What edge cases exist? Does this conflict with anything already in the codebase? If you're working with multiple agents, this is where an architecture agent or a second opinion is valuable. The exit condition is: you're confident the approach is sound.
**Phase 3: Spec.** You write down what you decided. Problem statement, proposed approach, files to modify, acceptance criteria that can be mechanically verified, and a test plan. This is the contract. The exit condition is: someone (human or agent) could read this spec and know exactly what to build and how to verify it.
**Phase 4: Implement.** The agent executes against the spec. Not against a vague idea. Against a concrete document with testable criteria. The exit condition is: the agent claims it's done and has posted verification evidence.
**Phase 5: Verify.** You (or a QA agent) confirm the implementation matches the spec. Not "does it look right" but "does it satisfy each acceptance criterion." The exit condition is: every criterion is checked, and the ones that fail get sent back to Phase 4.
The key insight: phases 1-3 are cheap. They take 10-20 minutes for a medium-sized feature. Phase 4 takes however long the implementation takes. Phase 5 takes 5-10 minutes. Skipping phases 1-3 doesn't save 10-20 minutes. It costs you the time to review, debug, and redo work that went in the wrong direction.
## What a Good Agent Spec Looks Like
Here's a real spec template. Not a user story. Not a product requirements doc. A working document that tells an agent exactly what to build.
```markdown
## Problem
The filter bar resets when switching workspaces. Users lose their
filter state and have to re-apply filters every time they switch.
## Approach
Persist filter state per-workspace in localStorage. Key the stored
state by workspace database path so filters don't bleed across
workspaces.
## Files to Modify
- lib/local-storage.ts: Add getWorkspaceFilters / setWorkspaceFilters
- components/filter-bar.tsx: Read initial state from localStorage,
write on every change
- hooks/use-workspace.ts: Trigger filter restore on workspace switch
## Acceptance Criteria
1. Select workspace A, set filters to status=open + type=bug
2. Switch to workspace B. Filters reset to defaults.
3. Switch back to workspace A. Filters restore to status=open + type=bug.
4. Close the browser tab, reopen. Filters for the active workspace
are still applied.
5. bd list --status=open --type=bug output matches the filtered table.
## Out of Scope
- Server-side filter persistence
- Filter presets / saved filter combinations
- URL-based filter state (query params)
## Test Plan
- Unit test: getWorkspaceFilters returns stored value for matching
workspace path
- Unit test: setWorkspaceFilters writes correct key format
- Manual test: steps 1-5 from acceptance criteria above
```
Notice what this spec does and doesn't contain. It doesn't explain how localStorage works. Claude Code knows that. It doesn't justify why we chose localStorage over URL params. That happened in the brainstorm phase. It does list every file the agent should touch, which means if the agent starts modifying files outside this list, that's a red flag. It does include an out-of-scope section, which prevents the agent from gold-plating.
The acceptance criteria are the most important part. Each one is a concrete action with an observable outcome. Not "filters should persist." That's ambiguous. "Switch to workspace A, verify filters are status=open + type=bug" is testable. An agent can execute that. A QA reviewer can verify it.
## The Plan-Before-Code Pattern
Here's a protocol that catches the majority of implementation mistakes before they become code: require the agent to post its implementation plan before writing anything.
In practice, this looks like a structured comment on the task. Before the agent opens any file, it writes out exactly what it intends to do.
```
PLAN: Persist filter state per-workspace using localStorage.
1. Add workspace-scoped storage helpers to lib/local-storage.ts:
- getWorkspaceFilters(dbPath: string): FilterState | null
- setWorkspaceFilters(dbPath: string, filters: FilterState): void
- Key format: "beadbox:filters:{dbPath}"
2. Update components/filter-bar.tsx:
- On mount, read stored filters for current workspace
- On every filter change, write to localStorage
- Accept databasePath as prop (currently not passed)
3. Update hooks/use-workspace.ts:
- On workspace switch, emit event that filter-bar listens for
- Filter-bar reads new workspace's stored filters on event
4. Threading databasePath:
- filter-bar needs databasePath from the workspace context
- Will add it to the WorkspaceProvider context value
Files: lib/local-storage.ts, components/filter-bar.tsx,
hooks/use-workspace.ts, components/workspace-provider.tsx
Test: Unit tests for storage helpers, manual test of all 5
acceptance criteria.
```
This takes the agent about 30 seconds to produce. It takes you about 2 minutes to read. And in those 2 minutes, you can catch problems that would take 20 minutes to fix after implementation:
- Is the agent touching files outside the spec? (Adding workspace-provider.tsx wasn't in the spec. Is that OK or is it scope creep?)
- Does the approach make sense? (Using an event emitter for workspace switches might be overengineered. A simpler prop change might work.)
- Are there missing steps? (What about cleaning up stale localStorage entries when a workspace is removed?)
The plan is a checkpoint. If it looks right, tell the agent to proceed. If it looks wrong, correct the plan. Either way, you've spent 2 minutes instead of 20.
## Verification Is Not "It Compiles"
The most common failure mode I see with Claude Code isn't that agents write bad code. It's that nobody verified the output against the spec.
The agent says "DONE." The developer glances at the diff, sees it looks reasonable, and merges. Two days later someone discovers the feature doesn't handle edge case #3 from the acceptance criteria. Now you're debugging in production instead of catching it during the 5-minute verification step.
Verification means mechanically checking each acceptance criterion. Not "it seems to work." Not "the tests pass" (tests can be wrong or incomplete). Each criterion from the spec gets a concrete check.
Here's what a proper completion report looks like:
```
DONE: Filter bar now persists selected filters across workspace
switches using per-workspace localStorage.
Changes:
- lib/local-storage.ts: Added getWorkspaceFilters/setWorkspaceFilters
with key format "beadbox:filters:{dbPath}"
- components/filter-bar.tsx: Reads stored filters on mount, writes
on change. Accepts databasePath prop.
- hooks/use-workspace.ts: Triggers filter restore on workspace switch
via callback prop.
QA Verification:
1. Open http://localhost:3000, select workspace A
2. Set filters to status=open, type=bug
3. Switch to workspace B via header dropdown
4. Switch back to workspace A
5. Verify filters are still status=open, type=bug
-> Confirmed: filters restore correctly
6. Close tab, reopen. Filters persist.
-> Confirmed: localStorage key present, filters applied on mount
7. Run: bd list --status=open --type=bug
-> Output matches filtered table contents (14 beads)
Acceptance criteria:
- [x] Filters persist across workspace switches (steps 2-5)
- [x] Filters survive browser restart (step 6)
- [x] Filtered view matches bd CLI output (step 7)
- [x] Filters don't bleed between workspaces (step 3: workspace B
shows defaults)
Unit tests: 3 added (storage read/write/key format). All passing.
Commit: a1b2c3d
```
The difference between this and "DONE: Fixed the filter bar" is the difference between a 5-minute QA pass and a 30-minute investigation. Every claim in the DONE comment is backed by a specific check. Every acceptance criterion is mapped to a verification step. The reviewer knows exactly what was built, how it was verified, and where to look if something seems off.
## Beads as a Spec Container
The lifecycle I just described needs a place to live. The spec, the plan comment, the implementation, the completion report, the verification results. All of it, attached to one task, in one place.
This is the problem [beads](https://github.com/steveyegge/beads) solves. Beads is an open-source, local-first issue tracker designed for exactly this workflow. Each "bead" is a task with a description (your spec), a comment thread (plans and completion reports), a status (open, in_progress, ready_for_qa, closed), and metadata like priority, dependencies, and assignments.
Here's what the spec-driven lifecycle looks like in practice with the `bd` CLI:
**Create the bead with your spec:**
```bash
bd create --title "Persist filter state across workspace switches" \
--description "## Problem
The filter bar resets when switching workspaces...
## Acceptance Criteria
1. Select workspace A, set filters...
2. Switch to workspace B..." \
--type feature --priority p2
```
**Agent claims the work and posts a plan:**
```bash
bd update bb-a1b2 --claim --actor eng1
bd comments add bb-a1b2 --author eng1 "PLAN: Persist filter state
per-workspace using localStorage.
1. Add workspace-scoped storage helpers...
2. Update filter-bar component...
3. ..."
```
**Agent completes the work and posts a done report:**
```bash
bd comments add bb-a1b2 --author eng1 "DONE: Filter bar now persists
selected filters across workspace switches.
QA Verification:
1. Open http://localhost:3000...
Acceptance criteria:
- [x] Filters persist across workspace switches
- [x] Filters survive browser restart
...
Commit: a1b2c3d"
bd update bb-a1b2 --status ready_for_qa
```
**QA picks it up and verifies:**
```bash
bd show bb-a1b2 # Read the spec and the DONE comment
# Run the verification steps
bd comments add bb-a1b2 --author qa1 "QA PASS: All 5 acceptance
criteria verified. Filters persist, restore, and match bd CLI output."
```
The entire lifecycle is in the bead. The spec is the description. The plan is a comment. The completion report is a comment. The QA result is a comment. Six months from now, if someone asks "how does filter persistence work and why did we choose localStorage over URL params?", the answer is in the bead's comment thread.
When you're running one spec through this pipeline, a terminal and `bd show` is enough. But this workflow really shows its value when you're running multiple specs in parallel.
## Scaling Spec-Driven Development
Picture the real scenario: you have three Claude Code agents, each implementing a different spec. Agent A is building a filter persistence feature. Agent B is adding a new API endpoint for workspace stats. Agent C is fixing a WebSocket reconnection bug. Each one is somewhere in the spec-driven lifecycle.
In the terminal, you'd need to run `bd list` to see all active beads, then `bd show` on each one to check its status and read the latest comment. That's six commands to get a snapshot of three parallel workstreams. Multiply that by five or ten agents and you're spending more time checking status than reviewing plans.
This is where [Beadbox](https://beadbox.app) fits. Beadbox is a real-time dashboard that shows you the state of every bead in your workspace. Which specs are open and waiting for an agent. Which have plans posted that need your review. Which are in progress. Which are ready for QA verification. All updating live as agents write comments and change statuses through the `bd` CLI.
You don't need Beadbox to do spec-driven development. The CLI handles the entire lifecycle. But when you're running multiple spec-driven workflows in parallel, being able to see the pipeline at a glance rather than polling each agent's status individually changes how fast you can review plans, unblock agents, and catch stalled work.
Beadbox is free during the beta, and the beads CLI it runs on is [open-source](https://github.com/steveyegge/beads).
## What Stays True Regardless of Tooling
Whether you use beads, GitHub Issues, Linear, or plain text files, the spec-driven pattern works because it addresses a fundamental asymmetry in how agents operate: they're fast at execution and bad at judgment. Every minute you spend writing a clear spec saves multiple minutes of reviewing incorrect output, debugging silent assumptions, and redoing work that went sideways.
The principles:
1. **Define "done" before "start."** Acceptance criteria are not optional. They're the only thing that makes verification possible.
2. **Plans are checkpoints, not bureaucracy.** A 30-second plan comment saves 20-minute rewrites. Review the plan, not the code.
3. **Verification is a protocol, not a vibe.** "Looks good to me" is not verification. Mapping each acceptance criterion to a concrete check is verification.
4. **The spec is the single source of truth.** When the implementation and the spec disagree, the implementation is wrong. This rule exists because agents won't question a bad plan. They'll execute it faithfully and produce faithfully wrong output.
5. **Scope boundaries prevent drift.** An explicit list of files to modify and an out-of-scope section keep the agent from "improving" things you didn't ask it to improve.
The investment is small: 10-20 minutes writing a spec for a feature that takes an hour to implement. The return is large: consistent results, reviewable output, and a permanent record of what was built and why.
If you're building workflows like this, star [Beadbox](https://github.com/beadbox/beadbox) on GitHub.
## Linear Alternatives: Why Local-First Issue Tracking Is Faster Than You Think
Published: 2026-02-23 · URL: https://beadbox.app/en/blog/linear-alternatives-local-first-issue-tracking
Linear is fast. Credit where it's due. They invested heavily in perceived performance, and for most teams, it's the best SaaS issue tracker available. But "best SaaS" comes with constraints that some developers can't accept: your data lives on someone else's servers, your workflow bends to match their opinions, and every interaction pays a network round-trip tax.
This post is for developers who've hit those walls. Maybe you're managing AI agent fleets that file 50 issues an hour. Maybe you work air-gapped or offline-first. Maybe you just don't want a login screen between you and your issues. Here's what we've learned building [Beadbox](https://beadbox.app), a native desktop issue tracker that keeps everything local.
**Jump to what matters to you:**
- [Local-first speed](#performance-real-benchmarks-on-a-10k-issue-dataset) — CLI and UI-level timings on real datasets
- [Git-native history](#git-integration-depth-beyond-linking-commits-to-issues) — branch, diff, and merge your issue database
- [Offline / air-gapped](#offline-first-is-not-a-feature-its-an-architecture) — no network, no daemon, no problem
- [No per-seat pricing](#no-per-seat-pricing-trap) — why SaaS pricing breaks with AI agents
- [Open-source ecosystem](#open-source-ecosystem) — 30+ community tools and full data portability
- [Agent-aware coordination](#agent-aware-coordination) — identity, `bd prime`, dependency graphs, fleet visibility
- [Scripting and agents](#extending-with-the-cli-not-a-rest-api) — three copy-pastable workflows
- [Tradeoffs](#what-beadbox-doesnt-do) — honest limitations before you invest time
- [Team decision matrix](#choosing-the-right-tool-for-your-team) — which tool fits which team shape
- [Migration from Linear](#migrating-from-linear-or-other-trackers) — what exists and what doesn't
## Why developers look for Linear alternatives
The usual answer is "Linear is too opinionated." That's true but imprecise. Linear enforces cycles, team structures, and workflow states that assume you're a product team shipping on two-week cadences. If that's you, Linear is great. If you're a solo developer coordinating AI agents, or a research team with non-standard iteration patterns, or a DevOps group that needs issues tied to git commits rather than Slack threads, Linear's opinions become friction.
The deeper problem is architectural. Linear is a cloud-first SaaS product. Every mutation travels to their servers and back. Every query depends on their uptime. Your issue data exists in their database, queryable through their API, on their terms. For most teams, that's a fine trade-off. For developers who care about data sovereignty, offline access, or raw query speed on large datasets, it's a dealbreaker.
## What Beadbox doesn't do
Before we get into what Beadbox is good at, here's where it's not the right choice. Skipping this section won't help you; hitting these walls after adopting a tool will.
**No multi-user permissions or access control.** There are no user accounts, no roles, no per-issue visibility restrictions. Everyone with filesystem access to the `.beads/` directory (or the Dolt server) can read and write everything. If you need to restrict who sees what, Beadbox isn't for you today.
**Limited real-time collaboration.** Two people can work on the same issue set, but the collaboration model is push/pull (like Git), not live cursors and presence indicators. In server mode, Beadbox polls for changes every 3-5 seconds. In embedded mode, filesystem watches detect changes faster (sub-second), but concurrent writes to the same Dolt database from two processes can crash. The safe pattern is: one writer at a time, or use server mode with Dolt handling concurrency.
**No integrations with Slack, GitHub, Figma, or other SaaS tools.** The extension point is the `bd` CLI and shell scripts. If your workflow depends on "issue closed triggers Slack message," you'll need to build that glue yourself.
**Scale ceiling is real but distant.** We test against 10K and 20K issue datasets (see benchmarks below). Those handle well. We haven't stress-tested at 100K+ issues. If you're a large organization generating hundreds of thousands of issues per year, this isn't proven territory.
**No non-technical stakeholder access.** There's no web portal, no guest viewer, no shareable dashboard URL. Beadbox is a desktop app that reads a local database. Showing progress to a PM who doesn't use your machine means a screen share or a `bd` script that generates a report.
## How Beadbox works (the 30-second version)
Before the benchmarks make sense, here's the architecture:

**Embedded mode:** The Dolt database lives in `.beads/` on your filesystem. No server process, no daemon. The `bd` CLI reads and writes directly. Beadbox detects changes via `fs.watch()` with a 250ms debounce and broadcasts over WebSocket to the UI. This is the zero-setup path.
**Server mode:** A `dolt sql-server` process runs separately (local or LAN). The `bd` CLI connects over MySQL protocol. Beadbox polls the server every 3-5 seconds for changes instead of watching the filesystem. This mode supports multiple concurrent writers.
Every operation the GUI performs routes through the `bd` CLI. Beadbox never touches the database directly. If `bd show` and Beadbox disagree, that's a bug in Beadbox.
## Performance: real benchmarks on a 10K-issue dataset
The [beads CLI publishes benchmarks](https://github.com/steveyegge/beads/blob/main/BENCHMARKS.md) you can reproduce on your own hardware. Here are real numbers from an M2 Pro running the Go benchmark suite against a 10,000-issue Dolt database:
| Operation | Time | Memory | Dataset |
|-----------|------|--------|---------|
| Filter ready work (unblocked issues) | 30ms | 16.8 MB | 10K issues |
| Search (all open, no filter) | 12.5ms | 6.3 MB | 10K issues |
| Create issue | 2.5ms | 8.9 KB | 10K issues |
| Update issue (status change) | 18ms | 17 KB | 10K issues |
| Cycle detection (5K linear chain) | 70ms | 15 KB | 5K deps |
| Bulk close (100 issues) | 1.9s | 1.2 MB | Sequential writes |
| Sync merge (10 creates + 10 updates) | 29ms | 198 KB | Batch operation |
These are CLI-level benchmarks: the time it takes `bd` to read from or write to the local Dolt database. The Beadbox UI adds rendering overhead on top. Our design targets for the full stack (CLI call + React render + WebSocket propagation) are:
| UI operation | Design target |
|-------------|---------------|
| Epic tree render (100+ issues) | < 500ms |
| Filter apply/clear | < 200ms |
| Workspace switch | < 1 second |
| Real-time update propagation (embedded) | < 2 seconds |
| Cold start to usable | < 5 seconds |
We don't publish benchmarks against Linear or other trackers because we haven't run controlled comparisons, and cherry-picked numbers wouldn't be honest. What we can say: the entire data path is local. There's no network hop between clicking a filter and seeing results. Whether that matters to you depends on your baseline. If Linear feels fast enough for your dataset size and location, it probably is. If you've felt the lag on a 500-issue backlog from a conference hotel Wi-Fi, you know the pain these numbers address.
To reproduce: clone [beads](https://github.com/steveyegge/beads), run `go test -tags=bench -bench=. -benchmem ./internal/storage/dolt/...`, and compare against your hardware. Cached datasets land in `/tmp/beads-bench-cache/`.
## Git integration depth: beyond linking commits to issues
Most issue trackers treat Git integration as a feature checkbox: mention an issue ID in a commit message, and a link appears on the issue. That's useful but shallow.
Beadbox is built on [beads](https://github.com/steveyegge/beads), an issue tracker where Git semantics are the storage layer, not a bolted-on integration. [Dolt](https://docs.dolthub.com/introduction/getting-started/git-for-data), the database underneath, implements Git's merkle tree data model for structured data. Every issue change is a commit. Every commit has a parent. You get `dolt diff`, `dolt log`, and `dolt merge` on your issue history with the same semantics you use on code.
What that means practically:
**Your issue history is auditable.** The database itself is a commit graph. You can diff any two points in time and see exactly which fields changed on which issues. This isn't an "audit log feature" bolted on top. The storage format is the audit trail.
**Branching works on issues, not just code.** Dolt supports branches natively. You can branch your issue database to experiment with a reorganization, then merge it back or throw it away.
**Sync is push/pull, not API calls.** Multi-machine collaboration works like `git push` and `git pull`. No API tokens, no webhooks, no OAuth flows. Point your Dolt remote at a server (or [DoltHub](https://www.dolthub.com/)) and push. The other machine pulls.
**A note on conflicts:** Dolt uses three-way merge, same as Git. If two people edit different fields on the same issue, the merge resolves automatically. If two people edit the same field on the same issue, you get a conflict that requires manual resolution through the Dolt CLI (`dolt conflicts resolve`). Beadbox doesn't have a conflict resolution UI yet; you handle conflicts at the `dolt` level. In practice, conflicts are rare when each person (or agent) works on distinct issues, which is the typical pattern. But if your team frequently edits the same issues concurrently, this is a friction point you should know about. The [Dolt merge documentation](https://docs.dolthub.com/concepts/dolt/git/merge) covers the resolution workflow in detail.
## Native rendering: why we bundle Node.js inside Tauri
Linear runs in a browser tab. So does Jira, Asana, and every other SaaS tracker. Browser tabs compete for memory, get suspended by the OS, and render through a compositor that adds frames of latency.
Beadbox runs as a native desktop application built on [Tauri](https://tauri.app/). Tauri apps are typically tiny (the Tauri runtime itself is single-digit megabytes) because they use the OS native WebView instead of bundling Chromium. Our bundle is larger than typical Tauri apps at ~160MB, and that's a deliberate tradeoff worth explaining.
84MB of that is an embedded Node.js runtime. We use a sidecar architecture: Tauri spawns a Next.js server as a child process, which handles server-side rendering, server actions, and the WebSocket layer for real-time updates. The Tauri WebView points at this local server. We chose this over a pure Rust backend because the Next.js ecosystem gives us React Server Components, server actions, and rapid iteration speed on the UI layer. The cost is bundle size. An equivalent Electron app would be 400MB+. A pure Rust + Tauri app would be under 10MB but would have taken 3x longer to build and would lose the React ecosystem.
The practical difference over a browser tab: Beadbox renders in a dedicated WebView process that doesn't share memory with your other 47 browser tabs. Expanding an epic tree with 100+ nested issues, applying filters across a full backlog, switching between workspaces: these operations feel qualitatively different when the renderer isn't competing for resources.
## Extending with the CLI, not a REST API
Linear has a GraphQL API. It's well-designed. But extending Linear means writing code that talks to their servers, authenticates with their tokens, and handles their rate limits.
Beadbox takes a different approach: the `bd` CLI is the API. Every operation the GUI performs goes through `bd`, the same command-line tool you'd use in your terminal.
Here are three workflows you can copy-paste today:
**Bulk-update priorities for a triage sweep:**
```bash
# Set all open bugs to priority 1 (critical)
bd list --status=open --type=bug --json | \
jq -r '.[].id' | \
xargs -I{} bd update {} --priority=1
```
**Generate a daily status summary:**
```bash
# What changed in the last 24 hours?
echo "=== Closed today ==="
bd list --status=closed --json | \
jq -r '.[] | select(.updated > (now - 86400 | todate)) | "\(.id) \(.title)"'
echo "=== Currently blocked ==="
bd blocked --json | \
jq -r '.[] | "\(.id) \(.title) (blocked by: \(.blocked_by | join(", ")))"'
echo "=== Ready to work ==="
bd ready --json | jq -r '.[] | "\(.id) [P\(.priority)] \(.title)"'
```
**AI agent creates and claims work:**
```bash
# Agent discovers a bug, files it, and claims it
ISSUE_ID=$(bd create \
--title "Fix race condition in auth middleware" \
--type bug \
--priority 1 \
--json | jq -r '.id')
bd update "$ISSUE_ID" --status=in_progress --assignee=agent-3
# ... agent does the work ...
bd update "$ISSUE_ID" --status=closed
bd comments add "$ISSUE_ID" --author agent-3 \
"Fixed in commit abc1234. Root cause: mutex not held during token refresh."
```
If you're running AI coding agents (Claude Code, Cursor, Copilot Workspace), they already know how to run CLI commands. No API client library, no authentication dance. Just Unix pipes and shell scripts.
[Try Beadbox](https://beadbox.app) to see these workflows visualized in real time as agents execute them.
## Offline-first is not a feature, it's an architecture
Some cloud trackers offer an "offline mode" that caches recent data and syncs when you reconnect. That's a feature bolted onto a fundamentally online architecture. The failure modes are predictable: stale cache, sync conflicts, operations that silently queue and fail later.
Beadbox works offline because it was never online in the first place. In embedded mode, your entire issue database is a directory on your filesystem. No server process. No daemon. No network socket. The `bd` CLI reads and writes to that directory. Beadbox watches it with `fs.watch()` and renders what it finds.
There's nothing to sync because there's nothing remote. If you later choose to collaborate, Dolt's push/pull gives you explicit, visible synchronization. But the default is local. The default is yours.
**What about security?** If you're evaluating Beadbox for air-gapped or sensitive environments, here's the concrete posture:
- **Encryption at rest:** Beadbox doesn't encrypt the `.beads/` directory itself. It relies on OS-level disk encryption (FileVault on macOS, LUKS on Linux, BitLocker on Windows). If your threat model requires per-database encryption, this is a gap.
- **Backups:** Your `.beads/` directory is a regular directory. `cp -r`, `rsync`, Time Machine, or `dolt push` to a remote all work. Dolt's commit history also means accidental changes can be rolled back with `dolt reset`.
- **What leaves the machine:** In embedded mode, nothing. Zero network calls. In the desktop app, two optional outbound connections exist: GitHub API to check for Beadbox updates (can be disabled in settings), and PostHog analytics if you opt in (disabled by default, no PII collected). Neither transmits issue data.
For air-gapped environments, classified projects, or developers who work on planes and trains, this isn't a nice-to-have. It's the only architecture that works.
## No per-seat pricing trap
Linear charges $8/month per member on the Standard plan. Reasonable for a five-person team. Less reasonable when your "team" includes 13 AI agents that need to read and write issues.
The per-seat model assumes stable, human-sized teams. Agentic engineering breaks that assumption. You might spin up 3 agents for a bug fix and 13 for a release. Each one needs API access. In SaaS pricing, every agent is a seat. Every seat is a line item. The cost scales linearly with a resource you're scaling exponentially.
[beads](https://github.com/steveyegge/beads) is open-source. The CLI is free. There is no per-seat fee, no usage tier, no "contact sales for enterprise." You can run 2 agents or 200 against the same local database and the cost doesn't change.
Beadbox (the GUI) is free during the beta. Post-beta pricing hasn't been finalized, but it won't be per-seat. Agents aren't people. Charging per agent makes as much sense as charging per terminal window.
## Open-source ecosystem
beads isn't a walled garden. The CLI is open-source at [github.com/steveyegge/beads](https://github.com/steveyegge/beads), and the community has built 30+ tools on top of it: custom reporters, CI integrations, agent orchestration scripts, dashboard extensions, and export adapters.
What this means practically:
**You can inspect everything.** The storage format is Dolt, which you can query with standard SQL. The CLI source is Go, readable and forkable. If `bd create` does something unexpected, you can read the code that runs it.
**You can extend without asking permission.** No marketplace approval process, no partner program, no API rate limit negotiation. Write a shell script, a Go plugin, or a Python wrapper. The CLI's `--json` flag on every command gives you structured output for piping into whatever you build.
**Your data is portable.** Dolt push/pull means your issue database can live on any server you control, sync to DoltHub, or stay on your filesystem forever. There's no export wizard because there's nothing to export from. The data is already yours, in a format you can query directly.
**The community is building agent-specific tooling.** The developers using beads daily are the ones running AI agent fleets. The extensions they build solve agent coordination problems: batch operations, dependency resolution scripts, fleet status reporters. This isn't theoretical community engagement. It's practitioners building tools for their own workflows and publishing them.
## Agent-aware coordination
Most issue trackers treat "automation" as a webhook that fires when a human changes a status. That's retrofitting an API onto a human-first workflow. beads and Beadbox were designed from the start for AI agent coordination.
**Structured agent identity.** Each agent gets a `CLAUDE.md` file that defines its role, boundaries, and communication protocol. The `bd` CLI's `--actor` and `--author` flags tie every action to a specific agent. When eng2 claims a task and posts a plan, the system knows it was eng2, not a generic "automation."
**The `bd prime` command.** Run `bd prime` in any workspace and it outputs a context block designed for AI coding assistants. Paste it into your agent's system prompt and it knows the full command set, output formats, and workflow patterns. Teaching a new agent to use beads takes one command, not a documentation page.
**Dependency graphs that agents actually use.** Agents don't work with Kanban boards. They work with trees and blockers. beads tracks parent/child relationships and blocking dependencies natively. `bd blocked` shows every bead waiting on something else. `bd ready` shows everything that's unblocked and ready for work. Beadbox renders this as an interactive dependency tree where you can see at a glance what's stuck and why.
**Real-time fleet visibility.** [Beadbox](https://beadbox.app) watches the beads database for changes and updates the UI within seconds. The Activity Dashboard shows agent status cards (who's active, who's quiet, who's stuck), a pipeline flow (where work is piling up), and a cross-filtered event feed (click an agent to see only their actions). This is the "mission control" view that makes 13 parallel agents manageable.
## Choosing the right tool for your team
No tool is universally correct. Here's an honest breakdown:
**Choose Linear if:**
- Your team is 10+ people and needs centralized project management
- You rely on Slack/GitHub/Figma integrations
- Non-technical stakeholders need access to your issue tracker
- You want managed infrastructure with zero operational overhead
- You're a product team shipping on regular cycles
**Choose Beadbox if:**
- You value data sovereignty (issues never leave your machine)
- You work offline regularly or in restricted network environments
- You manage AI agents that need to read and write issues programmatically
- You want Git-native issue history (branch, diff, merge your issues)
- You prefer CLI-first workflows with a visual companion when needed
- You're a solo developer or small team (1-10) that doesn't need enterprise features
**Keep using your current tool if:**
- Switching cost exceeds the friction you're experiencing
- Your team has invested in integrations that depend on your current tracker's API
- Your workflow already fits your tool's opinions
## Migrating from Linear (or other trackers)
Let's be direct: there is no automated Linear-to-Beadbox migration tool today. No CSV import wizard, no API bridge, no status mapping UI.
If you're starting fresh, that's fine. `bd init`, start creating issues, and Beadbox sees them immediately. Zero friction.
If you have an existing Linear project you want to bring over, the workable path right now is scripted: export from Linear's API (they support CSV and API export), transform the data, and use `bd create` in a loop to recreate issues. You'll lose Linear-specific metadata (cycles, project views, SLA timers) but preserve titles, descriptions, priorities, and status. A migration script is a weekend project, not a quarter-long integration.
We know this isn't good enough for teams with thousands of issues and years of history. Building a proper import pipeline is on our roadmap but not shipped yet. If migration friction is your primary concern, wait until we've built it, or evaluate whether starting fresh is acceptable for your use case.
## Getting started
Beadbox is free during the beta. Install it with Homebrew:
```bash
brew tap beadbox/cask && brew install --cask beadbox
```
If you already use beads, Beadbox detects your existing `.beads/` workspaces automatically. Open the app, and your issues are there. No import step. No account creation.
If you're new to beads, Beadbox walks you through initializing your first workspace. You'll be looking at your issues in under 60 seconds.
[Download Beadbox](https://beadbox.app) or check out [beads](https://github.com/steveyegge/beads) to see if local-first issue tracking fits your workflow.
## How to Manage Tasks for Claude Code Agents
Published: 2026-02-21 · URL: https://beadbox.app/en/blog/manage-tasks-claude-code-agents
You just spun up a second Claude Code agent. Now you have a problem.
The first agent is halfway through a refactor. The second one needs to build a feature that touches some of the same files. Neither knows the other exists. You're the router, the state store, and the conflict resolver, all at once, and your only tool is copy-pasting context between terminal windows.
This is where most developers hit the wall with Claude Code. Not because the agent is bad at coding. Because there's no system for telling it what to work on.
## The copy-paste problem
Most Claude Code workflows start the same way. You have a task in your head (or in Jira, or in a GitHub issue), and you paste the description into the agent's prompt. "Build an auth flow." "Fix the pagination bug." "Add dark mode support."
For a single agent, this works fine. The agent has the full context, you can watch its output, and you know when it's done because you're staring at it.
Add a second agent and the cracks appear immediately.
Agent A is refactoring the API layer. Agent B is building a new endpoint. Both are touching `server/routes.ts`. Neither knows about the other's changes. You discover the conflict when one of them pushes and the other's work breaks. Or worse, they both succeed locally but the merged result is broken in ways neither diff reveals.
The root cause isn't agents being sloppy. It's the absence of shared state. There's no place where "Agent A owns the API refactor" is recorded. There's no status that says "the routes file is being modified, wait your turn." The agents are operating on individual prompts with zero awareness of the larger picture.
Add a third agent and you're spending more time coordinating than coding.
## What agents actually need from a task system
Before reaching for a tool, it's worth asking: what does a Claude Code agent actually need to do good work?
It needs surprisingly little.
**A unique identifier.** Something it can reference in commits and comments. "Fixed the bug" is useless in a multi-agent log. "Completed PROJ-47: pagination returns wrong count on filtered views" is traceable.
**A clear scope.** Title, description, and acceptance criteria. Not a novel. Not a user story with personas. A concrete statement of what done looks like. "The `/users` endpoint returns paginated results. Page size defaults to 25. The `next_cursor` field is null on the last page."
**A status it can update.** The agent needs to signal where it is: claimed, in progress, done. Without this, you're back to peeking at terminal windows and guessing.
**Dependency awareness.** "Don't start this until PROJ-46 is merged" prevents the most common multi-agent failure: building on code that doesn't exist yet.
Notice what's missing from this list. Sprint planning. Velocity tracking. Kanban boards. Story points. Epics with color-coded labels. Agents don't need project management theater. They need a task, a status, and a way to say "I'm done."
## The CLAUDE.md contract
The task system tells agents *what* to work on. The CLAUDE.md file tells them *how* to work.
If you're running multiple Claude Code agents, each one should have a CLAUDE.md that defines its identity and boundaries. This isn't optional configuration. It's the difference between agents that coordinate and agents that step on each other.
Here's a stripped-down example for an engineering agent:
```markdown
## Identity
Engineer for the project. You implement features, fix bugs,
and write tests. You own implementation quality.
## What You Own
- All files under `components/` and `lib/`
- Unit tests in `__tests__/`
- You may read but not modify files under `server/`
## What You Don't Own
- Deployment configuration (that's ops)
- Issue triage and prioritization (that's the coordinator)
- QA validation (QA tests your work independently)
## Completion Protocol
Before marking any task done:
1. Run the full test suite: `pnpm test`
2. Verify your change works manually
3. Comment what you did with the commit hash
4. Push before reporting completion
```
The boundary section is the load-bearing part. Without explicit file ownership, agents wander. An engineering agent "helpfully" refactors the deployment config. A QA agent "fixes" a test by changing the code under test instead of the test itself. Explicit boundaries prevent these failure modes.
The completion protocol matters just as much. It prevents the most common agent failure: claiming something is done when it merely compiles. "Run the full test suite" and "verify manually" are concrete gates. An agent that follows this protocol produces work a human can trust. An agent without it produces work you have to double-check line by line.
Scale this across multiple agents and you get a fleet where each member knows its lane, its handoff protocol, and what "done" means.
## CLI-first task management
Here's a workflow observation that took me longer to internalize than it should have: Claude Code agents work dramatically better with CLI tools than with GUI interfaces.
This makes sense when you think about it. A Claude Code agent lives in the terminal. It can run commands, read output, and take actions based on results. Asking it to navigate a web UI, click buttons, and interpret rendered pages is fighting the agent's natural interface.
A CLI-based task system means the agent can do this in a single flow:
```bash
# Read the task
task show PROJ-47
# Claim it
task update PROJ-47 --status in_progress --assignee agent-1
# Do the work...
# Report completion
task comment PROJ-47 "DONE: Fixed pagination. Commit: abc1234"
task update PROJ-47 --status done
```
No context switching. No browser windows. No screenshots of a Kanban board. The agent reads a task, does the work, and updates the status, all without leaving the environment where it operates.
The output is machine-readable too. When you need to check what's happening across agents, you can query:
```bash
task list --status in_progress # What's being worked on?
task list --assignee agent-2 # What is agent-2 doing?
task list --blocked # What's stuck?
```
There's a subtler benefit too. CLI output becomes part of the agent's context. When an agent runs `task show PROJ-47` and sees the description, acceptance criteria, and dependency list in its terminal, that information is now in the conversation history. The agent can reference it, reason about it, and check its work against it. A GUI doesn't give you that. The information exists on a screen the agent can't see.
This is the shape of the tooling that works. A CLI that speaks the agent's language.
## Beads: local-first issue tracking for agents
The workflow I described above isn't hypothetical. It's what I run every day with [beads](https://github.com/steveyegge/beads), an open-source, local-first issue tracker built for exactly this kind of agent-driven development.
beads stores issues (called "beads") in a local Dolt database alongside your codebase. Each bead has an ID, title, description, status, priority, dependencies, and a comment thread. The CLI is called `bd`, and it's the interface agents use to read tasks, update status, and leave structured comments.
Here's a real workflow. I create a task:
```bash
bd create --title "Fix pagination on filtered views" \
--description "The /users endpoint returns wrong count when filters are applied. Page size defaults to 25. next_cursor should be null on the last page." \
--priority p2
```
An agent claims it:
```bash
bd update bb-r3k2 --claim --actor eng1
bd update bb-r3k2 --status in_progress
```
Before writing any code, the agent comments its plan:
```bash
bd comments add bb-r3k2 --author eng1 "PLAN:
1. Fix count query in /users to apply filters before COUNT()
2. Add cursor boundary check for last page
3. Add test cases for filtered pagination
Files:
- server/routes/users.ts - fix count query
- server/routes/users.test.ts - add filtered pagination tests"
```
This is a checkpoint. If the plan is wrong, you catch it in 30 seconds instead of discovering a bad implementation 45 minutes later.
The agent does the work, runs tests, then comments completion:
```bash
bd comments add bb-r3k2 --author eng1 "DONE: Fixed filtered pagination count.
- COUNT() now applies the same WHERE clause as the data query
- next_cursor returns null when offset + page_size >= total_count
- Added 4 test cases covering filtered + unfiltered pagination
Commit: a1b2c3d"
bd update bb-r3k2 --status ready_for_qa
```
The task now has a full audit trail: what was requested, what the agent planned, what it actually did, and the commit hash to review. A second agent running QA can pick it up and verify independently.
This works because beads speaks the same language as the agents. Everything is a CLI command. Everything produces structured output. There's no impedance mismatch between the tool and the agent.
## Seeing the big picture
The CLI workflow scales to 3 or 4 agents before you hit a new ceiling. Not a tooling ceiling. A cognitive one.
At 5 agents, running `bd list` and mentally assembling the state of the project is like reading a spreadsheet and trying to hold a dependency graph in your head. Which tasks are blocked? Which agent hasn't updated their status in 20 minutes? Is the feature epic 60% done or 80% done? The information is all there in the CLI output, but piecing it together takes effort that compounds with every additional agent.
This is where [Beadbox](https://beadbox.app) fits. It's a real-time dashboard that sits on top of beads and shows you the state of your entire agent fleet. Dependency trees rendered visually. Epic progress bars. Agent comment threads you can scan without running five `bd show` commands.
Beadbox doesn't replace the CLI. The agents still use `bd` for everything. Beadbox is the layer you open when you need the big picture: which workstreams are moving, which are stuck, and where the bottlenecks are. It watches the beads database for changes and updates in real time, so you're never looking at stale data.
It's free while in beta and runs entirely on your machine. No accounts, no cloud, your data stays local.
## Getting started
You don't need 13 agents to get value from structured task management. Start with two Claude Code agents and one rule: every task gets a bead, every agent comments its plan before coding, every completion includes verification steps.
The pattern compounds. Once agents have a shared task system, you can add QA agents that verify work independently. You can add a coordinator that dispatches tasks from a priority queue. You can scale to 5, 10, 15 agents without the coordination overhead growing linearly, because the protocols handle what used to be manual context-switching.
The key insight is that task management for Claude Code agents isn't about adopting a project management methodology. It's about giving agents the minimum structure they need to stay out of each other's way and produce verifiable output. Everything beyond that is overhead.
The tools:
- **[beads](https://github.com/steveyegge/beads)** for local-first task management. Open source.
- **[Claude Code](https://docs.anthropic.com/en/docs/claude-code)** as the agent runtime.
- **[Beadbox](https://beadbox.app)** for visual oversight when the fleet grows.
If you're building workflows like this, star [Beadbox](https://github.com/beadbox/beadbox) on GitHub.
## When to Use Claude Code Subagents vs Structured Task Breakdown
Published: 2026-02-19 · URL: https://beadbox.app/en/blog/claude-code-subagents-vs-task-breakdown
You have a feature that needs three things done at once. You could spawn subagents inside a single Claude Code session and let them work in parallel. Or you could split the work into three independent tasks, hand each to a separate agent in its own tmux pane, and let them run without knowing about each other.
Both approaches parallelize work. They solve different problems. Pick the wrong one and you'll either burn context window on coordination overhead or create merge conflicts that take longer to fix than the original task.
This is the decision framework I use every day while running [13 Claude Code agents](/blog/coding-with-13-agents) on the same codebase. It's not theoretical. It's the result of getting it wrong enough times to know where the boundary sits.
## Two Kinds of Parallelism
Claude Code supports two distinct ways to run work concurrently.
**Subagents** are child processes spawned within a single Claude Code session. The parent agent kicks off multiple subagents, each tackling a piece of the problem, then collects their results. They share the same working directory and the parent's context. Think of them as threads in a single process.
```
Parent agent
├── Subagent A: "Search lib/ for all usages of parseConfig"
├── Subagent B: "Search server/ for all usages of parseConfig"
└── Subagent C: "Search components/ for all usages of parseConfig"
```
**Separate agents** run in independent Claude Code sessions, typically in separate tmux panes. Each has its own context window, its own `CLAUDE.md` identity file, and its own view of the codebase. They don't share memory. They communicate through artifacts: task comments, status updates, committed code. Think of them as separate processes with no shared state.
```
tmux pane 1: eng1 agent → "Build the REST endpoint"
tmux pane 2: eng2 agent → "Build the React component"
tmux pane 3: qa1 agent → "Write integration tests for both"
```
The mental model matters because it determines how work flows between units. Subagents can pass data back to the parent cheaply. Separate agents pass data through the filesystem, git, or an external task tracker.
## When Subagents Win
Use subagents when the work shares state and the results need to converge.
**Parallel research.** You need to search five directories for a pattern, read three documentation files, and synthesize the findings into one recommendation. Subagents can each take a search path, return results, and the parent can combine them without any serialization overhead.
**Independent transformations on the same data.** You're refactoring a module and need to update the type definitions, the tests, and the documentation in one coherent change. Each subagent handles one file, but the parent ensures the changes are consistent because it sees all three results before committing.
**Fast exploration.** You're debugging and need to check the git log, the test output, and the runtime config simultaneously. Subagents can gather all three in parallel and the parent synthesizes a diagnosis.
The pattern: **fan out, gather back, act on the combined result.** If your parallelism ends with the parent needing to reason about all the outputs together, subagents are the right tool.
**What subagents are bad at:** anything that takes more than a few minutes per branch, anything that modifies files in overlapping paths, or anything that needs independent verification. Subagents share a working directory, so two subagents writing to the same file will corrupt each other's work. And because they share context, a long-running subagent eats into the parent's available window.
## When Separate Agents Win
Use separate agents when the work can be verified independently and doesn't need a shared context to make sense.
**Different components of the same feature.** "Build the API endpoint" and "Build the frontend that calls it" are independent until integration. The API engineer doesn't need the React component in context. The frontend engineer doesn't need the database schema. Giving each its own agent with a scoped `CLAUDE.md` keeps context clean and prevents one agent's complexity from bleeding into the other's work.
**Different acceptance criteria.** If task A is done when the endpoint returns 200 with the correct JSON shape, and task B is done when the component renders the data with proper error states, those are separate verification targets. A QA agent can validate each independently. Subagents can't be independently QA'd because they produce one combined output.
**Work that touches different parts of the codebase.** File ownership is the simplest way to prevent merge conflicts. Agent A owns `server/`, Agent B owns `components/`. Neither reaches into the other's territory. If you tried this with subagents, you'd need the parent to manage file locking, which defeats the purpose of parallelism.
**Tasks with different time horizons.** One task takes 10 minutes, the other takes 2 hours. With subagents, the parent waits for the slowest child. With separate agents, the short task completes, gets verified, and ships while the long task is still running.
The pattern: **fire, forget, verify separately.** If each piece of work stands alone and can be checked alone, separate agents with structured tasks are cleaner.
## The Handoff Problem
The real decision point comes down to handoffs.
Subagent handoffs are cheap. The child returns data to the parent in the same context. No serialization, no file writes, no waiting for a status update. The parent spawns three subagents, they return three results, the parent has everything it needs.
Separate agent handoffs are expensive but durable. Agent A completes work, commits code, updates a task status, and comments what it did. Agent B picks up that signal (either through a coordinator or by polling the task tracker) and starts its dependent work. The overhead is real: you need a task system, a status protocol, and some way for agents to discover what other agents have done.
Here's the rule of thumb: **if the work requires more than one handoff between the parallel units, use subagents.** If it's a single fan-out-and-gather, subagents are simpler. If Agent A's output is Agent B's input, which becomes Agent C's input, the coordination cost of separate agents is justified because each handoff produces a verified, committed artifact that won't be lost if an agent crashes or hits a context limit.
A concrete example. You need to:
1. Find all API endpoints that return user data
2. Add rate limiting to each one
3. Write tests for the new rate limits
4. Update the API documentation
Steps 1 and 2 are tightly coupled. The search results (step 1) feed directly into the modification (step 2). A subagent handles the search; the parent applies the changes. That's a subagent pattern.
Steps 3 and 4 are independent of each other but depend on step 2. The tests need the actual endpoint code. The docs need the final API shape. These are separate tasks for separate agents, each with its own acceptance criteria, each verifiable on its own.
## Structured Task Breakdown in Practice
When the answer is "separate agents," you need a way to decompose the feature into tasks that can run in parallel without stepping on each other.
The decomposition process:
**1. Identify the dependency graph.** Before splitting anything, map out what depends on what. Draw it on paper or just list it:
```
Feature: User profile page with activity feed
- API endpoint: GET /users/:id/profile (no deps)
- API endpoint: GET /users/:id/activity (no deps)
- React component: ProfileHeader (depends on profile API)
- React component: ActivityFeed (depends on activity API)
- Integration test: profile page end-to-end (depends on all above)
```
The two API endpoints have no dependencies. They can run in parallel. The two React components each depend on one API. The integration test depends on everything.
**2. Draw the ownership boundaries.** Each task gets a file scope. The profile API agent owns `server/routes/profile.ts` and `server/services/profile.ts`. The activity API agent owns `server/routes/activity.ts` and `server/services/activity.ts`. Neither touches the other's files. If a shared utility needs modification, one agent creates the change and the other waits for it.
**3. Define the acceptance criteria per task.** Each task needs a clear "done" condition that can be verified without looking at the other tasks. "Profile API returns 200 with correct shape" is verifiable. "Profile page works" is not, because it depends on integration.
**4. Specify the handoff artifacts.** What does a downstream agent need from an upstream agent? Usually: committed code on a known branch, a status update, and a comment describing the interface contract (API shape, component props, function signatures).
This decomposition turns a vague "build the profile page" into five discrete tasks with explicit dependencies and verification criteria. Each task can be assigned to an agent that has exactly the context it needs and nothing more.
## Beads for Structured Breakdown
This is where having a real task system matters. You can't track five parallel tasks with sticky notes and terminal output.
[beads](https://github.com/steveyegge/beads) is a local-first issue tracker that models this decomposition natively. An epic represents the feature. Children represent the subtasks. Dependencies prevent agents from starting work before prerequisites are done.
Here's what the breakdown looks like in practice:
```bash
# Create the epic
bd create --title "User profile page with activity feed" \
--type epic --priority p2
# Create subtasks as children
bd create --title "GET /users/:id/profile endpoint" \
--parent bb-epic1 --type task --priority p2
bd create --title "GET /users/:id/activity endpoint" \
--parent bb-epic1 --type task --priority p2
bd create --title "ProfileHeader React component" \
--parent bb-epic1 --type task --priority p2 \
--deps bb-profile-api
bd create --title "ActivityFeed React component" \
--parent bb-epic1 --type task --priority p2 \
--deps bb-activity-api
bd create --title "Profile page integration test" \
--parent bb-epic1 --type task --priority p2 \
--deps bb-profile-header,bb-activity-feed
```
Now the structure is explicit. An agent running `bd show bb-profile-header` sees that it depends on the profile API task. If that task isn't done yet, the agent knows not to start. When the API agent finishes and marks its task complete, the frontend agent's dependency clears.
The agent workflow follows a predictable loop:
```bash
# Agent claims the task
bd update bb-profile-api --claim --actor eng1
# Agent comments its plan before writing code
bd comments add bb-profile-api --author eng1 "PLAN:
1. Create route handler at server/routes/profile.ts
2. Add service layer at server/services/profile.ts
3. Return shape: { id, name, avatar, bio, joinedAt }
4. Test: curl localhost:3000/users/1/profile returns 200"
# Agent implements, tests, commits
# ...
# Agent marks done with verification steps
bd comments add bb-profile-api --author eng1 "DONE: Profile endpoint implemented.
Returns { id, name, avatar, bio, joinedAt }.
Verified: curl returns 200 with correct shape.
Commit: abc1234"
bd update bb-profile-api --status ready_for_qa
```
Every step is recorded. The QA agent reads the DONE comment and knows exactly how to verify. The downstream agent reads the PLAN comment and knows the API contract before the code is even finished.
This isn't overhead for the sake of process. It's the minimum structure that prevents five parallel agents from producing five incompatible pieces of code.
## Choosing by Default
After months of running parallel agents on production work, here's the decision tree I follow:
**Start with subagents when:**
- The task is research or exploration (searching, reading, comparing)
- Results need to converge into a single action
- The total work fits inside one context window
- There's no need for independent verification of each parallel unit
**Switch to separate tasks when:**
- Different parts of the work touch different files
- Each piece has its own acceptance criteria
- You want QA to verify pieces independently
- The work will take long enough that one piece might finish hours before another
- Agents need different context (a frontend agent doesn't need database internals)
**The hybrid approach for complex features:**
Use subagents for the research and planning phase (fan out, gather information, synthesize a plan), then break the implementation into separate tasks for independent agents. The [spec-driven development workflow](/blog/spec-driven-development-claude-code) fits naturally here: a single agent with subagents writes the spec, then the spec decomposes into tasks for the [multi-agent fleet](/blog/claude-code-multi-agent-workflow-guide).
## Visualizing the Breakdown
Once you have five or ten structured tasks with dependencies between them, tracking progress in the terminal gets difficult. `bd list` shows you a flat list. It doesn't show you which tasks are blocked, which are ready to start, or how far the epic has progressed.
This is the problem [Beadbox](https://beadbox.app) solves. It reads the same beads database and renders epic trees with progress indicators, dependency relationships, and agent assignments. You see which subtasks are done, which are blocked on prerequisites, and which are ready for an agent to pick up. The dependency graph that you specified with `--deps` becomes a visual map of your parallel work.
When an agent finishes a task and updates the status, Beadbox reflects the change in real time. No refresh, no re-running `bd list`. The tree updates, the progress bar moves, and blocked tasks become unblocked as their dependencies resolve.
It's the same data. Just visible.
---
If you're building workflows like this, star [Beadbox](https://github.com/beadbox/beadbox) on GitHub.
## Managing Claude Code Agent Context Without MCP Sprawl
Published: 2026-02-17 · URL: https://beadbox.app/en/blog/claude-code-context-management-mcp
You started with one MCP server. File access, so your Claude Code agent could read and write your project. Reasonable.
Then you added web search. Then GitHub. Then a database tool so the agent could query your schema directly. Then Slack, because the agent needed to check a thread for requirements. Then a docs tool for your internal wiki.
Six MCP servers. Each one registers tool schemas in the agent's context. Each one widens the surface area of what the agent *could* do, which means more tokens spent on tool descriptions and more opportunities for the agent to wander off-task.
Your agent still writes good code. But it writes it slower, and the output has gotten less predictable. You're not imagining it. The context window is the bottleneck, and you're filling it with plumbing.
## The accumulation problem
MCP servers are powerful. The Model Context Protocol gives Claude Code access to external systems, and each integration genuinely solves a problem. File access lets the agent read your codebase. Web search lets it look up documentation. GitHub integration lets it check PR status.
The trouble starts when you solve every agent need by adding another MCP.
Agent needs to check the database schema? Add a Postgres MCP. Agent needs to read a Confluence page? Add a Confluence MCP. Agent needs to post a Slack message? Add a Slack MCP. Each one is individually justified. Collectively, they create a problem that's hard to notice until output quality drops.
Every MCP server registers its tools in the conversation context. A file access MCP might register 5-10 tools. A database MCP registers another handful. A GitHub MCP adds more. By the time you have six MCP servers, the agent is carrying dozens of tool definitions in its context window before it reads a single line of your code.
Those tool definitions aren't free. They consume tokens. And more importantly, they compete for the agent's attention. When an agent has 40 available tools, every decision point becomes a branching question: should I use the file tool, the search tool, the database tool, or the GitHub tool? The agent spends cognitive budget deciding *how* to get information instead of *using* information to solve your problem.
## Context is finite. Attention is scarcer.
Claude Code's context window is large. That creates a dangerous illusion: that you can keep adding information without consequence.
In practice, agent performance degrades well before the context window fills up. The issue isn't capacity. It's signal-to-noise ratio. An agent with a 200K token context window performs better with 50K tokens of focused, relevant information than with 150K tokens where the relevant bits are scattered across tool schemas, API responses, and tangential file contents.
This is the same problem humans face with too many browser tabs. The information is technically available. Finding it takes longer than it should. You end up re-reading things you already saw because the relevant context got pushed out of working memory by noise.
For agents, this manifests as:
**Rabbit holes.** The agent has a database tool, so it queries the schema. The schema is interesting, so it queries some data. The data reveals something unexpected, so it investigates further. Twenty minutes later, you have a thorough analysis of your database contents and zero progress on the feature you asked for.
**Tool confusion.** With many tools available, the agent occasionally picks the wrong one. It uses the web search tool to find documentation that's already in a local file. It queries the database when the answer is in the task description. Each wrong tool choice wastes tokens and introduces noise.
**Diluted focus.** The agent's "attention" is a finite resource within each generation. When the context contains tool schemas for file access, web search, database queries, GitHub operations, Slack messages, and wiki lookups, the agent processes all of that before it processes your actual request. The task competes with the tooling for cognitive priority.
## Bounded context: the alternative to tool sprawl
The reflexive response to "my agent needs information X" is to give the agent a tool that fetches X. But there's another approach: put X in the task.
This is the bounded context pattern. Instead of giving agents access to everything and hoping they find what's relevant, you give each agent a task that contains everything it needs to complete the work. The agent doesn't search for context. The context is delivered.
The difference is structural. With MCP sprawl, the agent's workflow looks like:
1. Read the task
2. Figure out what information is missing
3. Use various tools to gather that information
4. Synthesize the information
5. Do the actual work
With bounded context, it looks like:
1. Read the task (which contains all necessary context)
2. Do the actual work
Steps 2-4 in the first workflow aren't just overhead. They're where things go wrong. The agent gathers too much information, or the wrong information, or gets distracted by interesting but irrelevant data. Every tool invocation is a potential detour.
Bounded context doesn't mean agents can't use tools. File access is still necessary for reading and writing code. But it means the *informational* context (what to build, why, which files, what the acceptance criteria are) lives in the task, not in a tool the agent has to query.
## Structuring tasks as context containers
A task that works as a context container looks different from a typical Jira ticket or GitHub issue. It's self-contained. An agent reading it should have everything it needs to start working without querying external systems for background information.
Here's what that looks like in practice:
```
Title: Add rate limiting to /api/search endpoint
Description:
The /api/search endpoint currently has no rate limiting.
Add a token bucket rate limiter at 100 requests/minute per IP.
Files to modify:
- server/middleware/rate-limit.ts (create new)
- server/routes/search.ts (apply middleware)
- server/config.ts (add RATE_LIMIT_RPM env var)
Acceptance criteria:
- Requests beyond 100/min from same IP return 429
- Rate limit resets after 60 seconds
- Config value overridable via environment variable
- Existing tests still pass
Context:
- We use Express middleware pattern (see server/middleware/auth.ts for example)
- The config module uses dotenv (see server/config.ts lines 1-15)
- No Redis available; use in-memory store. This is a single-instance app.
Dependencies: None. This can run independently.
```
Notice what's embedded in the task. The agent knows which files to touch, what pattern to follow, what constraints exist (no Redis), and exactly what "done" looks like. It doesn't need a database MCP to check the schema. It doesn't need a wiki tool to find the middleware pattern. It doesn't need to search the codebase to understand the config approach. All of that is in the task.
Writing tasks this way takes more effort upfront. A typical ticket might say "Add rate limiting to search endpoint" and leave the agent to figure out the rest. But that figuring-out process is exactly where MCP sprawl comes from: the agent needs information, so you give it tools, and the tools eat context.
## CLAUDE.md as a context boundary
The task tells the agent what to build. The CLAUDE.md file tells it what world it lives in.
If you're running [multiple Claude Code agents](/blog/claude-code-multi-agent-workflow-guide), each one should have a CLAUDE.md that defines its scope, not just its instructions. Think of it as a context fence: everything inside the fence is the agent's concern, and everything outside is someone else's problem.
```
## Identity
Frontend engineer for ProjectX. You own components/, hooks/,
and app/pages/. You write React components with TypeScript.
## What you do NOT own
- server/ (backend engineer handles this)
- database/ (DBA handles schema changes)
- infrastructure/ (ops handles deployment configs)
## How to get information you need
- API contracts are in docs/api-spec.md
- Design specs are linked in the task description
- If you need backend changes, create a task for the backend agent
```
This CLAUDE.md eliminates an entire category of MCP need. The frontend agent doesn't need a database MCP because it doesn't touch the database. It doesn't need a deployment tool because it doesn't handle infrastructure. Its context window stays clean because its scope is narrow.
The "how to get information" section is critical. Instead of giving the agent a tool to search for API contracts, you tell it where the contracts live. Instead of giving it Slack access to ask the backend team questions, you tell it to create a task. The information flow is explicit, not emergent.
This is the same principle behind [managing tasks for Claude Code agents](/blog/manage-tasks-claude-code-agents): agents work better with clear boundaries than with unlimited access. Every boundary you define is an MCP server you don't need.
## When you still need MCPs
Bounded context doesn't eliminate MCPs entirely. Some tools are genuinely necessary:
**File system access** is non-negotiable. Agents need to read and write code. This isn't sprawl; this is the baseline.
**Version control tools** (git operations) are part of the agent's core workflow. Committing, branching, and diffing are implementation actions, not information-gathering detours.
**Language servers and linters** provide real-time feedback that can't be pre-loaded into a task description. The agent needs to know if its code compiles and passes type checks.
The distinction is between *implementation tools* (things the agent uses to do the work) and *information-gathering tools* (things the agent uses to figure out what the work is). Implementation tools belong in the agent's MCP config. Information-gathering tools are a sign that your task descriptions need more context.
If you find yourself adding an MCP because "the agent needs to look up X," ask whether X could be in the task instead. If yes, put it there. If no (because X changes frequently, or is too large, or requires real-time data), then the MCP is justified. But that question is worth asking every time.
## Beads: tasks as bounded context
This is the pattern we use to [coordinate 13 Claude Code agents](/blog/coding-with-13-agents) on a single codebase. Each agent gets a task that contains its full scope, and a CLAUDE.md that defines its boundaries. The combination means agents rarely need tools beyond file access and git.
The issue tracker that makes this work is [beads](https://github.com/steveyegge/beads), an open-source, local-first CLI. Each "bead" is a self-contained unit of work: title, description, acceptance criteria, and a comment thread where agents post plans and completion reports.
Creating a task with embedded context:
```bash
bd create --title "Add rate limiting to /api/search" \
--description "Token bucket at 100 req/min per IP. \
Files: server/middleware/rate-limit.ts (new), \
server/routes/search.ts, server/config.ts. \
Pattern: see server/middleware/auth.ts. \
Constraint: in-memory store, no Redis." \
--priority p2
```
The agent claims the task and reads it:
```bash
bd update bb-r3k2 --claim --actor eng1
bd show bb-r3k2
```
Everything the agent needs is in the bead. The description includes files, patterns, and constraints. The agent doesn't need a wiki MCP to find the middleware pattern, because the task says "see server/middleware/auth.ts." It doesn't need a database MCP, because the task says "no Redis, use in-memory store."
Before writing code, the agent posts its implementation plan:
```bash
bd comments add bb-r3k2 --author eng1 "PLAN:
1. Create server/middleware/rate-limit.ts with token bucket
2. Wire into search route in server/routes/search.ts
3. Add RATE_LIMIT_RPM to server/config.ts with default 100
4. Add tests for 429 response and reset behavior"
```
After implementation, the agent posts what it did and how to verify:
```bash
bd comments add bb-r3k2 --author eng1 "DONE: Rate limiting added.
Commit: abc123
Verification:
- curl /api/search 101 times in 60s, 101st returns 429
- Set RATE_LIMIT_RPM=5, verify limit changes
- pnpm test passes (3 new tests added)"
```
The entire lifecycle, from task creation through implementation to verification, lives in one place. No context was lost to tool-hopping. No tokens were spent querying external systems for information that could have been written into the task.
## Seeing context boundaries across the fleet
When you're running multiple agents with bounded context, a new question emerges: whose task references whose files? Where do context boundaries overlap? Which agent is working on the API layer, and can I safely assign the frontend work in parallel?
This is where the CLI alone gets limiting. `bd list` shows you tasks and statuses. It doesn't show you the relationships between them, or let you spot when two agents' scopes have drifted into the same territory.
[Beadbox](https://beadbox.app) is a real-time dashboard that visualizes these boundaries. It shows dependency trees (which tasks block which), epic progress (how far along a feature is across all its subtasks), and agent ownership (who's working on what). You see the full picture without switching between terminal windows and assembling it in your head.
It's free during the beta and runs entirely on your machine. No accounts, no cloud sync, no telemetry on your project data.
If you're building workflows like this, star [Beadbox](https://github.com/beadbox/beadbox) on GitHub.
## AI Code Review Is Broken. Here's What's Missing.
Published: 2026-02-14 · URL: https://beadbox.app/en/blog/ai-code-review-whats-missing
Let's be honest about something most of us aren't saying out loud: we barely review AI-generated code.
The diff is 600 lines. The agent touched 14 files. You open the pull request, scroll through the changes, squint at a few functions, and merge. Maybe you run the tests first. Maybe you don't. The code looks reasonable. The agent said it's done. Ship it.
This isn't laziness. It's a structural problem. Traditional code review was designed for a world where a human wrote the code and could explain their reasoning when asked. Where diffs were 50-200 lines because that's how much a person writes in a focused session. Where the PR description said "I chose approach X because of Y" and you could trust that context.
AI agents don't work that way. Claude Code can produce 500 lines of working code in two minutes. The PR description is often just "implement feature X." The diff tells you *what* changed but nothing about *why*. No record of which alternatives the agent considered. No explanation of which tradeoffs it made. No evidence that it actually tested anything. You're reviewing the output of a black box, and the review tool only shows you the output.
This article breaks down why diff-based review fails for agent output, what the actual missing layer is, and a concrete pattern that makes AI-generated code reviewable without tripling your review time.
## The Review Gap
Developers are honest about this in private. In community threads, the pattern repeats: "I mostly skim agent diffs." "I check the tests pass and merge." "If it looks roughly right, I approve it."
This is rational behavior given the constraints. When a human colleague submits a PR, you have context: you know what they were working on, you've seen the ticket, you might have discussed the approach at standup. The diff is supplementary. The real review happened through shared context.
With an agent, you have none of that. The agent claimed a task, went silent for three minutes, and produced a diff. The only context is whatever one-line description the agent left on the PR. Reviewing that diff from scratch, with no context about intent or reasoning, takes 5-10x longer than reviewing a human's PR of the same size. So people don't. They spot-check a few critical areas and approve.
The result is predictable. Bugs slip through that would have been caught with context. Architectural drift accumulates as agents make small decisions that compound. Code quality degrades in subtle ways: not broken, but not quite right either. Inconsistent error handling in one file. A database query that works but scales poorly. A new utility function that duplicates an existing one because the agent didn't know it existed.
None of these failures are visible in a diff review. They're only visible when you understand what the agent was trying to do and can compare its intent against its execution.
## Why Diffs Aren't Enough
A diff is a record of textual changes. That's it. For human code review, diffs work because the reviewer can infer intent from pattern recognition and shared context. You see a colleague add a `try/catch` block and you know they're handling the error case from last week's bug report. You see them rename a function and you know they're following the naming convention the team agreed on.
With agent-generated code, you can't infer intent because you weren't part of the reasoning process. Here's what a 500-line agent diff actually tells you:
- Which files were modified
- What lines were added, changed, or removed
- The syntactic structure of the new code
Here's what it doesn't tell you:
**Why this approach was chosen.** The agent might have considered three different implementations. It picked one. You don't know why. Maybe the one it picked is optimal. Maybe it's the first thing it tried and it worked well enough. You can't tell from the diff.
**What alternatives were discarded.** If the agent chose a polling strategy over WebSocket subscriptions, was that a deliberate architectural decision or an accident? A diff doesn't say.
**Whether the implementation matches the spec.** You'd need to open the spec in one window and the diff in another and manually cross-reference each acceptance criterion. Most people don't.
**What was tested and how.** The diff might include new test files. But did the agent run them? Did they pass? Do they cover the edge cases from the spec? You'd need to check out the branch and run them yourself to know.
**Whether the agent stayed in scope.** Maybe the task was "fix the login bug" and the agent also refactored the auth middleware, renamed two utility functions, and updated the config schema. All of those changes look fine in isolation. But they weren't asked for, they weren't spec'd, and they weren't tested against the original acceptance criteria.
This isn't a problem with any particular diff tool. GitHub's review interface, GitLab's merge requests, Gerrit, `git diff` in the terminal. They all show you the same thing: what changed. For agent output, what changed is the least important question. The important question is: *does this change do what it was supposed to do, and nothing else?*
## The Missing Layer: Implementation Narrative
What reviewers actually need is the agent's reasoning trail. Not the diff. The story of the implementation: what the agent planned to do, what it actually did, and how it verified the result. Call it an implementation narrative.
A good implementation narrative answers five questions:
1. **What was the plan?** Before writing code, what did the agent intend to do? Which files, which approach, which order of operations?
2. **What happened during implementation?** Did the plan survive contact with the codebase? Were there surprises, pivots, or scope changes?
3. **What was the final result?** Not the diff. A plain-language summary of what changed and why.
4. **How was it verified?** Specific steps the agent took to confirm the implementation works. Not "tests pass" but "I ran acceptance criterion #3 by doing X and observed Y."
5. **What should the reviewer check?** The agent's own recommendation for what deserves human attention. Maybe there's a design decision that could go either way, or a performance tradeoff worth a second opinion.
None of this exists in a standard PR workflow. The PR description field is free text that nobody enforces. Agent PRs default to minimal descriptions because the agent was told to implement, not to document its reasoning.
The gap isn't tooling. It's process. The review infrastructure exists. What's missing is a structured record of agent intent that the reviewer can check against the diff.
## The Plan-Comment-Done Pattern
Here's a pattern that closes the gap without adding significant overhead. It has three parts: the agent comments a plan before it writes code, it implements, and it comments a structured done report when it finishes.
**Step 1: The Plan Comment**
Before the agent opens any file, it writes out what it intends to do. Numbered steps, files it will touch, and the approach it will take.
```
PLAN: Fix WebSocket reconnection dropping messages during
server restart.
1. Add a message buffer to hooks/use-websocket.ts that queues
outbound messages while the connection is in CONNECTING state
2. On successful reconnection, flush the buffer in order
3. Add a 30-second timeout: if reconnection hasn't succeeded,
surface an error to the user via the toast system
4. Update the existing reconnection test to verify buffer
behavior
Files: hooks/use-websocket.ts, components/connection-status.tsx
Test: Unit test for buffer queueing/flushing, manual test by
killing the WS server mid-operation and verifying no messages
are lost on reconnect.
```
This takes the agent about 30 seconds to produce. The reviewer reads it in under 2 minutes. In those 2 minutes, you catch problems that would take 20 minutes to find in a diff review:
- Is the scope right? (The plan says 2 files. If the diff touches 6, something drifted.)
- Is the approach sound? (A message buffer with a flush-on-reconnect is reasonable. If the agent had proposed re-fetching all state from the server, you'd want to discuss that first.)
- Are there missing steps? (What about messages that were sent during the timeout window? Should they be dropped or retried?)
The plan is a lightweight checkpoint. Review it, approve it, and the agent proceeds with shared understanding of the intent.
**Step 2: Implementation**
The agent writes the code. Nothing changes here. But because the plan exists, the agent has a roadmap it can follow rather than making ad hoc decisions as it goes.
**Step 3: The Done Comment**
When the agent finishes, it posts a structured completion report. Not "done." Not "implemented the feature." A detailed account of what it actually did.
```
DONE: WebSocket reconnection now buffers outbound messages
during CONNECTING state and flushes on successful reconnect.
Changes:
- hooks/use-websocket.ts: Added messageBuffer ref, queue
messages when readyState !== OPEN, flush in FIFO order on
'open' event. Added 30s reconnection timeout.
- components/connection-status.tsx: Shows "Reconnecting..."
badge during buffer state, switches to error toast after
timeout.
QA Verification:
1. Start dev server and WebSocket server
2. Open app, verify connection dot is green
3. Kill WebSocket server process
4. Trigger an action that sends a WS message (e.g., update
a bead status)
5. Restart WebSocket server within 30 seconds
6. Verify: the buffered message is delivered, bead status
updates in the UI
7. Repeat step 3, but wait >30 seconds before restart
8. Verify: error toast appears after timeout
Acceptance criteria:
- [x] Messages sent during reconnection are not lost (step 6)
- [x] Timeout surfaces user-visible error (step 8)
- [x] No behavior change when connection is stable (step 2)
Commit: f4e2a1b
```
Now the reviewer has everything they need. They read the plan (what was intended), read the done comment (what was actually built and how it was verified), and then look at the diff with full context. The diff review goes from "what is all this?" to "let me confirm this matches what the agent said it did."
## Review Checklists for Agent Output
Even with the implementation narrative, you need a systematic approach. Here's a checklist I use when reviewing Claude Code output. It takes 5-10 minutes per review and catches the categories of bugs that diffs alone miss.
**Spec alignment:**
- Does the implementation address every acceptance criterion from the spec?
- Are there changes that go beyond what the spec asked for?
- Does the done comment map each criterion to a verification step?
**Scope containment:**
- Did the agent only modify files listed in its plan?
- If it touched additional files, is there a stated reason?
- Are there "cleanup" changes (renames, reformats, refactors) that weren't part of the task?
**Test coverage:**
- Do new tests exist for new behavior?
- Are the tests actually testing the right thing? (Agents sometimes write tests that pass trivially because they test the mock, not the implementation.)
- Did the agent claim it ran the tests? Is there evidence?
**Architectural consistency:**
- Do the changes follow existing patterns in the codebase?
- Are there new abstractions that duplicate existing ones?
- Does the error handling strategy match the rest of the project?
**Dependency awareness:**
- If the agent added dependencies, are they justified?
- Do the changes break any existing functionality? (Check files that import the modified modules.)
- If the task has dependencies on other tasks, are those dependencies resolved?
This checklist works with any code review tool. Print it on a sticky note, keep it in your PR template, or build it into your CLAUDE.md so the agent knows what standard it's being held to. The point isn't the specific items. It's having a structured protocol instead of "looks good to me."
## Beads as a Review Surface
The plan-comment-done pattern needs a place to live. If plans and done comments are scattered across Slack messages, PR descriptions, and terminal output, you lose the connection between the spec, the plan, the implementation, and the verification.
This is the problem [beads](https://github.com/steveyegge/beads) solves. Beads is an open-source, Git-native issue tracker where each "bead" carries the entire lifecycle of a task: the spec as the description, agent plans as comments, done reports as comments, and QA results as comments. All attached to one entity, searchable, and permanent.
Here's what the review workflow looks like with the `bd` CLI:
**Create the task with the spec:**
```bash
bd create --title "Fix WebSocket reconnection message loss" \
--description "## Problem
Messages sent during WebSocket reconnection are silently
dropped...
## Acceptance Criteria
1. Messages queued during CONNECTING state are delivered
on reconnect
2. 30-second timeout surfaces error to user
3. No behavior change when connection is stable" \
--type bug --priority p1
```
**Agent claims the work and posts a plan:**
```bash
bd update bb-f4e2 --claim --actor eng1
bd comments add bb-f4e2 --author eng1 "PLAN: Add message
buffer to WebSocket hook...
1. Queue outbound messages when readyState !== OPEN
2. Flush buffer in FIFO order on 'open' event
3. Add 30s timeout with error toast
4. Update reconnection test
Files: hooks/use-websocket.ts, components/connection-status.tsx"
```
**You review the plan in 2 minutes:**
```bash
bd show bb-f4e2 # Read spec + plan comment
```
If the plan looks right, the agent proceeds. If it doesn't, you comment back with corrections before any code is written.
**Agent completes and posts a done report:**
```bash
bd comments add bb-f4e2 --author eng1 "DONE: WebSocket
reconnection now buffers outbound messages...
QA Verification:
1. Kill WS server, trigger action, restart within 30s...
Acceptance criteria:
- [x] Buffered messages delivered on reconnect
- [x] Timeout error visible
- [x] No regression on stable connection
Commit: f4e2a1b"
bd update bb-f4e2 --status ready_for_qa
```
**QA verifies independently:**
```bash
bd show bb-f4e2 # Read the done comment's verification steps
# Execute each step
bd comments add bb-f4e2 --author qa1 "QA PASS: All 3 criteria
verified. Buffer flushes correctly, timeout fires at 30s,
stable connections unaffected."
```
The entire review trail is in one place. Six months later, when someone asks "why does the WebSocket buffer messages during reconnection?", the answer is in the bead: the spec explains the problem, the plan explains the approach, the done comment explains what was built, and the QA comment confirms it works.
## When Terminal Review Hits Its Ceiling
Running `bd show` on one task gives you everything. But when you're reviewing multiple agents' output across several parallel workstreams, the CLI workflow scales linearly: one `bd show` per task, one `bd list` to see what's ready for review, one `bd show` per plan you need to approve.
This is where [Beadbox](https://beadbox.app) fits. Beadbox is a real-time dashboard that shows you every task in your workspace with its current status, latest comment, and position in the review pipeline. You see which agents have posted plans that need your approval. Which have posted done reports ready for your review. Which are still in progress. All updating live as agents write comments and change statuses through the `bd` CLI.
You don't need Beadbox to use the plan-comment-done pattern. The CLI handles the full workflow. But when you have five agents producing reviewable output simultaneously, being able to see the review queue at a glance instead of polling each task individually changes how fast you move through the pipeline.
Beadbox is free during the beta, and the beads CLI it runs on is [open-source](https://github.com/steveyegge/beads).
## The Review Problem Won't Solve Itself
AI-generated code is increasing faster than our ability to review it. The tools we have were built for a different scale and a different workflow. GitHub PRs, IDE diffs, even sophisticated static analysis: none of them address the fundamental problem, which is that reviewing code without knowing the author's intent is dramatically harder than reviewing code with it.
The fix isn't better diff tools. It's structured intent: a record of what the agent planned to do, what it actually did, and how it verified the result. The plan-comment-done pattern gives you that record without adding significant overhead. The agent spends 30 seconds writing a plan. You spend 2 minutes reviewing it. The agent spends 60 seconds writing a done report. You review the diff with full context instead of from scratch.
Five principles to take away:
1. **Require plans before code.** A 30-second plan comment saves 20-minute review sessions. If the plan is wrong, fix it before the code exists.
2. **Demand structured done reports.** "Done" is not a done report. Verification steps, acceptance criteria mapping, and commit hashes are a done report.
3. **Review against the spec, not the diff.** The diff shows what changed. The spec says what should have changed. Cross-reference them.
4. **Enforce scope boundaries.** If the agent touched files outside its plan, that's a flag. Unplanned changes are unreviewed changes.
5. **Treat review as a protocol, not a judgment call.** A checklist catches more bugs than intuition. "Looks good to me" is not a review.
The agents will keep getting faster. The diffs will keep getting larger. The question is whether your review process scales with them, or whether you're still squinting at 600-line diffs and hoping for the best.
If you're building workflows like this, star [Beadbox](https://github.com/beadbox/beadbox) on GitHub.
## The Spec-First Claude Code Development Workflow
Published: 2026-02-12 · URL: https://beadbox.app/en/blog/spec-first-ai-development-workflow
There is a widening gap between developers who get reliable output from Claude Code and developers who spend half their day undoing what the agent just built. The difference is not talent, experience, or some secret prompt engineering trick. It is a methodology question. The developers shipping production software with AI agents have converged on a pattern, whether they call it that or not: define what you want before the agent starts writing code.
This article gives that pattern a name. Spec-first development is a methodology for AI-assisted software engineering. Not a vague "best practice." A structured, repeatable lifecycle with defined phases, clear checkpoints, and concrete artifacts at every step. If you have been searching for a way to make Claude Code output predictable enough to bet your release schedule on, this is the framework.
## The Vibe Coding Ceiling
"Vibe coding" entered the vocabulary in early 2025. The pitch: describe what you want in natural language, let the AI write it, iterate until it looks right. For prototypes, weekend projects, and one-off scripts, vibe coding works. You get something functional fast, and if it breaks later, the stakes are low.
Production software operates under different constraints. The code must integrate with an existing codebase, satisfy specific requirements, and survive contact with other people who will maintain it. When vibe coding meets these constraints, the failure modes are predictable.
The first failure is drift. You describe a feature loosely, the agent implements its interpretation, you adjust, the agent reimplements its adjusted interpretation. Three iterations later, you have working code that satisfies none of your original requirements because each iteration shifted the target. You are converging on what the agent thinks you want, not on what you actually need.
The second failure is invisible decisions. Every gap in your description is a decision the agent makes silently. Database schema, error handling strategy, API shape, validation rules, library choices. You discover these decisions during code review, or worse, in production. The agent did not make bad decisions. It made *uninstructed* decisions, and you had no mechanism to catch them before they were baked into the implementation.
The third failure is review paralysis. A 600-line diff where the agent chose the architecture, the data model, the error codes, and the edge case handling is not reviewable in the traditional sense. You are not reviewing code against a spec. You are reverse-engineering the spec from the code, then deciding whether you agree with it. This takes longer than writing the spec would have.
Vibe coding hits a ceiling because it conflates two distinct activities: deciding what to build and building it. Spec-first development separates them.
## Spec-First as a Methodology
Spec-first development is a four-phase lifecycle. Each phase produces a concrete artifact. Each transition has a clear gate condition. The methodology works with any AI coding agent, but the examples in this article use Claude Code because that is where the community is iterating fastest.
### Phase 1: Brainstorm
You and the agent (or just you) explore the problem space. What are the constraints? What approaches exist? What are the tradeoffs? This is conversational. You are not committing to anything. You are mapping the territory.
The gate condition: you have a preferred approach and you can articulate why this approach over the alternatives.
Brainstorming with Claude Code is valuable because the agent has broad knowledge of patterns and libraries. The mistake is jumping from brainstorm directly to code. The brainstorm surfaces options. It does not choose among them. You do.
### Phase 2: Spec
You write down the decision. This is the contract the agent will implement against. A spec is not a user story, not a Jira ticket, not a paragraph of prose. It is a structured document with:
- **Problem statement**: what is broken or missing, in concrete terms
- **Proposed approach**: the chosen solution from the brainstorm phase
- **Files affected**: which files the agent should touch (and implicitly, which it should not)
- **Acceptance criteria**: testable conditions that define "done"
- **Out of scope**: what the agent should explicitly avoid
The acceptance criteria are the most important element. Each one must be a concrete action with an observable outcome. "Authentication should work" is not a criterion. "Submitting valid credentials returns a 200 with a session token; submitting invalid credentials returns a 401 with no token" is.
The out-of-scope section prevents gold-plating. Without it, agents will "improve" adjacent code, refactor files they noticed were messy, or add features that seem related. Every minute the agent spends on unrequested work is a minute you spend reviewing unrequested work.
The gate condition: someone who was not in the brainstorm could read this spec and build the right thing.
### Phase 3: Implement
The agent executes against the spec. Not against a conversation. Not against a memory of what you discussed. Against a concrete document with testable criteria.
Before writing any code, the agent produces a plan: a numbered list of changes it intends to make, which files it will modify, and how it will verify the result. This plan is a two-minute checkpoint. You read it, confirm it matches your intent, and green-light the implementation. Or you catch a misunderstanding and correct it. Either way, you have spent two minutes instead of twenty.
The plan-before-code pattern is not bureaucracy. It is the single highest-leverage intervention in the entire workflow. Most implementation mistakes are not coding errors. They are comprehension errors: the agent misunderstood the spec. Catching a comprehension error in a plan costs two minutes. Catching it in a 400-line diff costs twenty. Catching it in production costs a day.
The gate condition: the agent has posted a completion report with specific claims about what was built and how it was verified.
### Phase 4: Verify
You or a QA process confirm the implementation against the spec. Not "does it look right?" but "does it satisfy each acceptance criterion?"
Verification is mechanical. You take each criterion from the spec, execute the test (run a command, open a browser, trigger an event), and record the result: pass or fail. Criteria that fail go back to Phase 3. The verification is documented alongside the implementation so that anyone who reads the task six months from now can see exactly what was tested.
The gate condition: every acceptance criterion has a recorded pass/fail result.
That is the complete lifecycle. Four phases, four artifacts (approach rationale, spec, implementation plan, verification record), four gate conditions. The phases are sequential but lightweight. For a medium-sized feature, phases 1 and 2 take 15-20 minutes. Phase 3 takes whatever the implementation takes. Phase 4 takes 5-10 minutes.
## Why This Matters More with Agents Than Humans
Every argument for writing specs predates AI. "Write requirements before code" has been advice since before most of us were born. So why frame this as something specific to AI-assisted development?
Because agents change the cost function.
A human developer who receives a vague requirement will stop and ask questions. "Did you mean password auth or SSO?" "Should this work on mobile?" "What happens when the token expires?" Every question is a mini-checkpoint that nudges the implementation toward the correct target. The cost of a vague spec with a human developer is a few Slack threads and maybe an afternoon of rework.
An agent who receives a vague requirement will not stop. It will make every ambiguous decision silently, commit to an approach, and present you with a finished implementation. The cost of a vague spec with an agent is a finished implementation that may be entirely wrong, plus the time you spend discovering it is wrong, plus the time you spend redoing it.
The asymmetry is stark. Agents are faster at execution and worse at judgment than human developers. Every ambiguity in the spec is a judgment call, and every judgment call the agent makes without guidance is a coin flip on whether the result matches your intent. A spec eliminates coin flips.
There is a second, subtler reason. Agents do not push back. A senior engineer who receives a bad spec will say "this doesn't make sense because X." An agent will implement a bad spec faithfully and produce faithfully wrong output. Spec-first development forces you to pressure-test your own thinking *before* handing it to an entity that will execute it without question. The spec is not just for the agent. It is for you.
## The Plan-Before-Code Checkpoint
If you take one practice from this article and ignore the rest, take this one.
Before the agent writes any code, require it to post an implementation plan. Not code. Not a diff. A structured outline of what it intends to do.
A plan looks like this: numbered steps in execution order, files to be modified, logic changes in each file, and the verification approach. The agent produces this in about thirty seconds. You read it in about two minutes. In those two minutes, you can catch:
- **Scope violations**: the agent plans to modify files not listed in the spec
- **Architectural mismatches**: the agent chose an approach that conflicts with existing patterns
- **Missing steps**: the plan does not address an acceptance criterion
- **Overengineering**: the agent plans to build abstractions that are not warranted
The 2-minute plan review replaces the 20-minute diff review where you discover these problems after they are already built. It is the cheapest quality gate in software engineering.
I wrote a detailed walkthrough of the plan-before-code pattern in [Spec-Driven Development with Claude Code](/blog/spec-driven-development-claude-code), including spec templates and completion report formats. This article focuses on *why* the pattern works; that one focuses on *how* to implement it.
## Verification as a First-Class Step
The most underinvested phase in most developers' workflows is verification. The agent says "done." The developer glances at the diff. The merge happens. The bug surfaces two days later when a user hits edge case number three from the acceptance criteria.
Spec-first development treats verification as a formal step with its own artifacts. The completion report maps each acceptance criterion to a concrete check:
- Criterion: "Switching workspaces restores the saved filter state."
- Check: Open the app, set filters in workspace A, switch to workspace B, switch back to workspace A, observe that filters are restored.
- Result: Pass.
This is not overhead. This is the step that determines whether the implementation actually satisfies the spec. Without it, the spec is a wishlist and the acceptance criteria are aspirational.
The verification record also solves a downstream problem: code review. When a reviewer opens the pull request, they read the spec, read the verification record, and review the diff with full context. Review time drops because the reviewer is confirming a verified claim, not conducting an investigation.
When you run multiple agents in parallel, each implementing a different spec, verification discipline is the difference between a controlled pipeline and a pile of code that "probably works." Each spec has criteria. Each implementation has a completion report. Each completion report maps criteria to checks. Nothing ships without recorded verification.
## Objections and Honest Tradeoffs
Spec-first development is not free. The objections are real and worth addressing head-on.
**"Writing specs slows me down."** In isolation, yes. Writing a spec for a feature takes 15-20 minutes. But you recover that time (and more) in the implementation and review phases. An agent with a clear spec produces a correct implementation more often than an agent with a vague prompt. Fewer iterations, fewer rewrites, shorter reviews. The net effect for features of any substance is faster delivery, not slower.
For trivial changes (rename a variable, fix a typo, bump a version), specs are unnecessary overhead. Spec-first is for work where the implementation requires decisions. If the change is mechanical and unambiguous, skip the spec.
**"My agent is good enough without specs."** For some tasks, probably true. Claude Code is remarkably capable at inferring intent from brief descriptions. The question is not whether the agent *can* produce good output from vague instructions. It is whether it does so *reliably*. If you are comfortable with occasional rework and unpredictable review times, vibe coding may be sufficient for your use case. Spec-first pays off when consistency and predictability matter: when the feature is complex, when the code ships to production, when someone else will maintain it.
**"Specs get stale."** Valid concern. A spec written during brainstorming might not survive contact with reality. The fix is not to skip specs. It is to update the spec when the plan reveals new information. If the agent's plan shows that the approach in the spec will not work, revise the spec before proceeding. The spec is a living document for the duration of the implementation. It becomes a historical record after verification.
**"This is just waterfall."** No. Waterfall's failure was big specs for big projects with long feedback cycles. Spec-first development operates at the task level: one spec per feature or fix, written in 15-20 minutes, implemented in hours, verified the same day. The feedback loop is tight. The investment per spec is small. If the spec is wrong, you find out during the plan review, not six months later.
## Tooling the Spec-First Lifecycle
The methodology works with any task system: GitHub Issues, Linear, Notion, plain text files. What matters is that the spec, plan, implementation notes, and verification results all live in one place, attached to one task.
If you are looking for a system designed for this workflow, [beads](https://github.com/steveyegge/beads) is an open-source, Git-native issue tracker that holds the full lifecycle. Each "bead" carries a description (your spec), a comment thread (plans and completion reports), a status (open, in_progress, ready_for_qa, done), and metadata like dependencies and priorities. The `bd` CLI operates from the terminal, which means agents can read specs, post plans, and report completions without leaving their working environment.
```bash
bd create --title "Persist filter state across workspaces" \
--description "## Problem ..." --type feature --priority p2
bd update bb-a1b2 --claim --actor eng1
bd comments add bb-a1b2 --author eng1 "PLAN: ..."
# After implementation:
bd comments add bb-a1b2 --author eng1 "DONE: ... Commit: a1b2c3d"
bd update bb-a1b2 --status ready_for_qa
```
The entire lifecycle happens in the CLI. Six months later, `bd show bb-a1b2` returns the full history of what was specified, planned, built, and verified.
When you are running one agent through this lifecycle, the CLI is sufficient. When you are running five or ten in parallel, each at a different stage of the spec-implement-verify pipeline, you need to see the state of the pipeline at a glance. [Beadbox](https://beadbox.app) is a real-time dashboard that shows which specs are open, which have plans waiting for review, which are in progress, which are blocked, and which are ready for verification. It monitors the same beads database the agents write to, updating live as statuses change.
You do not need Beadbox to practice spec-first development. The methodology is tool-agnostic. But when parallel workstreams turn your pipeline into a queue of tasks you cannot track from memory alone, the visual layer changes how fast you can review, unblock, and ship.
## The Broader Shift
Spec-first development is not a reaction to AI coding agents being bad. It is a recognition that they are good at the wrong things without guidance. Agents are extraordinarily capable executors. They write correct syntax, follow patterns, handle boilerplate, and produce volume that no human can match. What they lack is the context to make good decisions about what to build. That context comes from you, and the spec is the vehicle.
The developers who will thrive in AI-assisted engineering are not the ones who write the best prompts. They are the ones who write the best specs. Prompts are ephemeral. Specs are durable. Prompts optimize for a single interaction. Specs optimize for a lifecycle: brainstorm, define, implement, verify.
This is not a temporary workaround until agents get smarter. Even as models improve, the fundamental asymmetry remains: the human knows what the business needs; the agent knows how to write code. A spec bridges the two. Better models will execute specs faster, but the need for the spec does not go away. It gets more important as you scale, because more agents running against vague instructions produce more divergent output.
If you have been running Claude Code agents and finding the results inconsistent, or spending too much time on review, or struggling to coordinate parallel workstreams, try this: before the next feature, take 15 minutes to write a spec with testable acceptance criteria, require the agent to post a plan before coding, and verify the output criterion by criterion. One cycle will show you the difference.
If you're building workflows like this, star [Beadbox](https://github.com/beadbox/beadbox) on GitHub.
## Hello from Beadbox
Published: 2026-02-10 · URL: https://beadbox.app/en/blog/hello-world
Welcome to the Beadbox blog. This is where we'll share product updates, engineering deep dives, and thoughts on building tools for AI agent workflows.
## What is Beadbox?
Beadbox is a real-time visual dashboard for the [beads](https://github.com/steveyegge/beads) issue tracker. It gives you dependency graphs, epic progress trees, and live updates across your agent fleet.
## What to expect
We'll be posting about:
- Product launches and feature announcements
- The architecture behind real-time updates and local-first data
- How we use AI agents to build Beadbox itself
- Lessons learned shipping a native macOS app with Tauri
Stay tuned.
## Why We Built Beadbox
Published: 2026-02-10 · URL: https://beadbox.app/en/blog/why-we-built-beadbox
You can run 10 AI coding agents in parallel now. Spin up a tmux session, give each agent a task, and let them coordinate through [beads](https://github.com/steveyegge/beads). It works. We do it every day.
But here's what nobody talks about: you can't see any of it happening.
## The visibility gap
beads solved the memory problem. Before beads, agents forgot everything between sessions. They'd churn through markdown todo files, lose context after compaction, and re-discover the same bugs three times. beads gave them persistent, structured, git-backed memory. That was a breakthrough.
But beads is a CLI tool. It's built for agents, not for the humans supervising them. When you want to understand the state of your project, you run `bd list`. You get a flat list of issues. You run `bd show bb-abc` to read one. Then another. Then you run `bd dep list` to understand what's blocking what. Piece by piece, you reconstruct the picture in your head.
That's fine for five issues. It falls apart at fifty. And when you have 10 agents filing, updating, and closing issues in real time, the CLI can't keep up with you, let alone with them.
## What we built
Beadbox is the visual layer on top of beads. It watches your `.beads/` directory for changes and renders everything in a native desktop app within milliseconds. When an agent updates an issue in the terminal, you see it in Beadbox before your shell prompt returns.
No accounts. No cloud. No syncing. Your data stays on your machine, in the same `.beads/` directory your agents already use. Beadbox just reads it and shows you what's happening.
Here's what that looks like in practice:
**Epic trees with progress bars.** Your top-level epic shows 7 of 12 children complete. You expand it, see which subtasks are blocked, which are in QA, and which agent is working on what. One glance replaces a dozen `bd show` commands.
**Real-time sync.** We watch the filesystem for database changes. When an agent commits a status change, Beadbox picks it up through a file-watch pipeline and pushes it to the UI over WebSocket. No polling. No refresh button.
**Multi-workspace support.** If you're working across multiple projects, switch between beads databases from a dropdown. Each workspace remembers its own filters and view state.
**Dependency visibility.** Blocking relationships show up as badges on every issue. You can see at a glance that bb-q3l is waiting on bb-f8o without running a single command.
## How we build Beadbox
We use beads and Beadbox to build Beadbox. That's not a gimmick. Our daily workflow runs 10+ Claude Code agents coordinated through a supervisor agent. Engineering, QA, product, marketing, shipping, all tracked as beads in a single database. Nelson watches the whole operation in Beadbox while agents file issues, claim work, push code, and report back.
Every feature we ship gets tested on our own workflow first. If the epic tree doesn't make sense when you have 50 active issues across 6 agents, we fix it before anyone else hits that wall.
The tech stack is intentionally boring: Next.js for the UI, Tauri for the native wrapper, the `bd` CLI as the single source of truth. We never read the database directly. Every operation goes through `bd`, which means Beadbox always agrees with your terminal.
## Where this is going
Today, Beadbox is a dashboard. You watch your agents work. You triage issues. You track progress across epics.
Tomorrow, it becomes the control plane. We're building toward a world where you can dispatch work to agents, review their output, and manage your entire fleet from one window. The terminal stays the agent's home. Beadbox becomes yours.
We're in beta, so it's free. [Try it.](https://beadbox.app)